In the News:
First cold snap of 2015 increases natural gas demand 23%
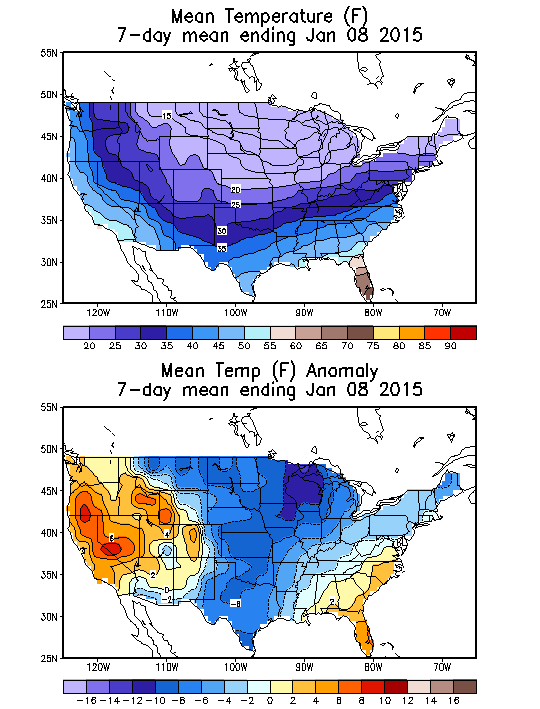
Colder-than-normal temperatures in the eastern half of the United States drove up natural gas demand across all sectors during January 7 through January 10. During this period, average U.S. natural gas consumption rose 23% compared to the average consumption for the week preceding this cold snap. The high demand was met by continued strong production, increased storage withdrawals, and more imported natural gas.
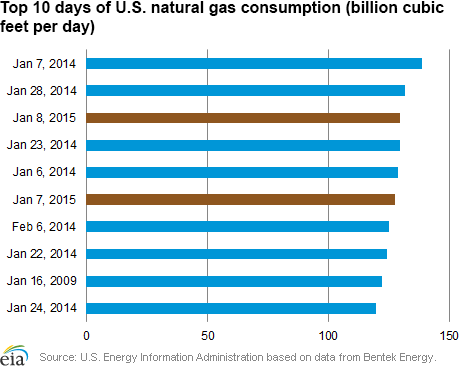
Total U.S. consumption averaged more than 122 billion cubic feet per day (Bcf/d) through the four-day cold spell, peaking at more than 130 Bcf/d on Thursday, January 8, according to data from Bentek Energy. Consumption on Thursday was the third-highest level since 2005, the start of Bentek’s data series. The largest demand increase came from the residential/commercial sector because of increased space heating requirements. Consumption grew for this sector during the cold spell by more than 27% over the previous week.
Power burn (natural gas used for electrical generation) rose by 19% during the four-day period. The Southeast, a region where electricity is used as the primary energy for space heating, showed a significant increase in demand during the cold spell, averaging 9.5 Bcf/d from January 7 through January 10, an increase of 35% from the previous week.
The increase in consumption was met by a combination of storage withdrawals and increased imports. Net natural gas inventory withdrawals for the week ending January 9 totaled 236 Bcf, according to EIA’s Weekly Natural Gas Storage Report. This is the highest withdrawal so far this winter. In addition to the increase in storage withdrawals, imports of natural gas from Canada grew by 21% during the four-day cold snap compared to the prior week, averaging 7.8 Bcf/d. LNG sendout more than doubled during that period, ramping up to more than 2 Bcf/d on January 8.
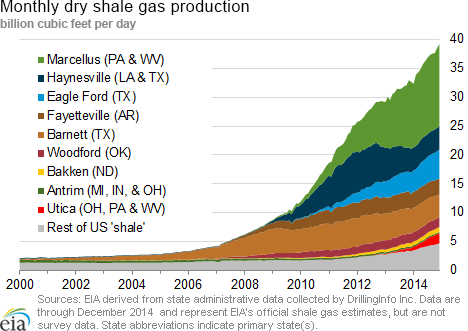
The largest source of U.S. natural gas supply is domestic dry gas production. Freeze-offs of natural gas producing wells contributed to slight declines in production, on average, from January 7 through January 10, compared to the previous week. Production during the four-day period averaged 70 Bcf/d, but that is more than 8% above the average daily production recorded for January 2014. The relatively high level of domestic production is reducing the reliance on natural gas storage and may also be contributing to moderating prices on peak-demand days.
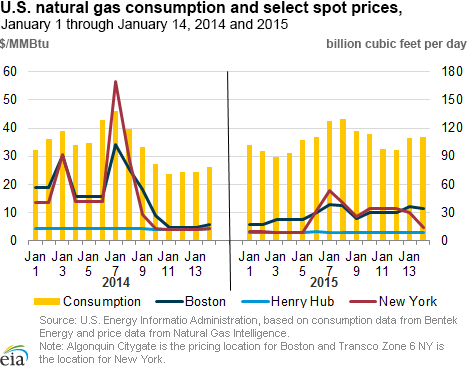
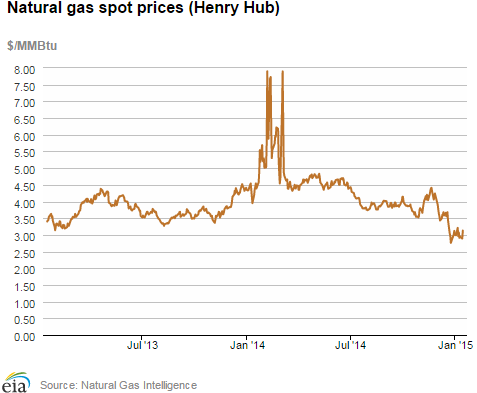
Despite the heightened demand on January 7 through January 10, the Henry Hub natural gas spot price remained relatively low. For most days during the cold snap, the price at Henry Hub was below $3 per million British thermal units (MMBtu). Although prices in the Northeast increased to around $12/MMBtu during the cold snap, this is significantly less than the prices that occurred during the cold spells experienced this past winter.
Overview:
(For the Week Ending Wednesday, January 14, 2015)
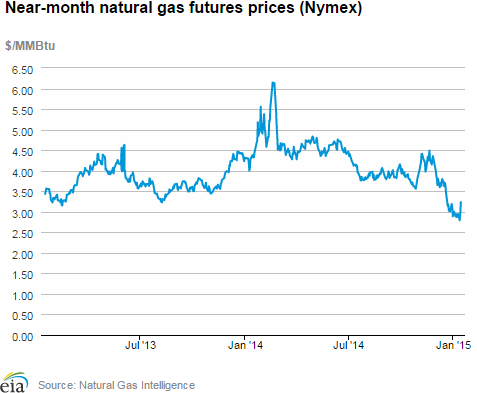
- Movements in natural gas spot prices were mixed across the country despite persistent cold weather over the report week (Wednesday to Wednesday). The Henry Hub spot rose from $3.07/ MMBtu last Wednesday, January 7, to $3.13/MMBtu yesterday.
- At the New York Mercantile Exchange (Nymex), the February 2015 contract rose over the report period, beginning at $2.871/MMBtu last Wednesday and ending at $3.233/MMBtu yesterday.
- Working natural gas in storage decreased to 2,853 Bcf as of Friday, January 9, according to the U.S. Energy Information Administration (EIA) Weekly Natural Gas Storage Report (WNGSR). A net withdrawal from storage of 236 Bcf for the week resulted in storage levels 11.0% above year-ago levels and 3.8% below the five-year average for this week.
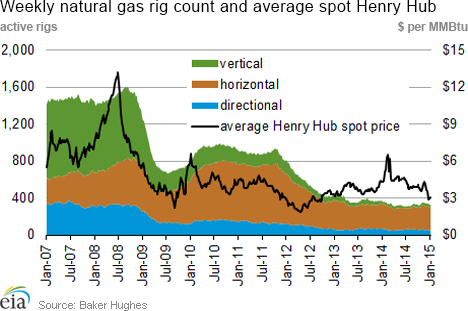
- The total U.S. rotary rig count decreased by 61 units to 1,750 rigs for the week ending January 9, according to data from Baker Hughes Inc. The natural gas rig count increased by 1 unit to 329, while oil rigs decreased by 61 units to 1,421. Most likely related to the sharp decline in crude oil prices, this is the second-largest week-on-week decline in the oil rig count recorded in the Baker Hughes data set, and the largest decline in nearly 25 years. The data set extends back to 1987.
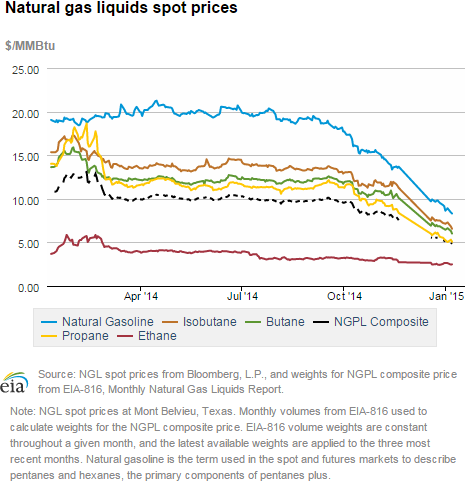
- The Mont Belvieu natural gas plant liquids composite price fell again this week, dropping by 4.9% to $4.90/MMBtu for the week ending January 9. With the continued decline in crude oil prices, NGL prices have been falling as well. All Mont Belvieu NGL spot prices are down this week, with natural gasoline falling 6.8% and isobutane falling 7.2%.
Prices/Demand/Supply:
Natural gas spot prices mixed with seasonal winter weather. Prices in Louisiana and Texas generally edged upward for the report period, while prices at most other locations fell. Henry Hub began the week at $3.07/MMBtu last Wednesday, and closed yesterday at $3.13/MMBtu. With colder weather, a 24¢ increase in the Henry Hub price on Wednesday drove the overall weekly increase in prices at that location. Prices at most trading locations outside the Gulf Coast states declined slightly, with prices in the Rockies falling by 5¢ to 10¢ for the report week, and prices at the Chicago Citygate declining by 20¢.
Northeastern spot prices moderate. Prices at most locations in the Northeast declined, with price points feeding major consuming areas dropping by significant margins. The Algonquin Citygate price, delivering to Boston, fell by $1.74 to close at $10.80/MMBtu yesterday. Transco Zone 6 NY, delivering to New York City, fell by $9.08, closing at $4.67/MMBtu yesterday. In addition to closer-to-average temperatures at the end of the report week, power loads also moderated at the end of the report week in the Northeast and New England area contributing to this decline.
Marcellus-area prices remain low, some falling to a dollar. Several Marcellus-region prices in the Northeast also continued to decline over the report week. Prices at the Transco-Leidy Line in Pennsylvania fell by 36¢ to $1.01/MMBtu over the report week. Similarly, Tennessee Zone 4 Marcellus prices fell by 27¢, to $1.15/MMBtu yesterday. The Dominion South point strengthened somewhat, with prices at that location rising 26¢ to close at $1.64 yesterday. Very substantial production gains over the past few years, especially compared with last year, combined with constrained pipeline takeaway capacity have boosted the supply of natural gas within the region.
Nymex February contract price rises over the report week. At the New York Mercantile Exchange (Nymex), the February 2015 contract rose significantly Wednesday-to-Wednesday, beginning the report week at $2.871/MMBtu last Wednesday and ending at $3.233/MMBtu yesterday. The 12-month strip, which averages the February 2015 through January 2016 contracts, closed yesterday at $3.183/MMBtu, indicating market expectations of enduring low natural gas prices for the year.
Natural gas liquids prices continue to decline with crude oil. Natural gas liquids prices, which are historically linked to crude oil prices, have been high compared with natural gas prices in recent years. But as global crude oil prices have fallen by more than half since July 2014, natural gas liquids prices have fallen sharply as well. The NGPL composite price averaged just $4.90/MMBtu this week, its lowest level since EIA began producing the series in 2009.
U.S. dry gas production is close to flat during the report week. Dry gas production fell by 0.3% over the report week, according to data from Bentek Energy. Despite reports of production freeze-offs in Louisiana, Texas, Pennsylvania, and Ohio, overall levels of production remain high. Dry gas production was 10% above last year's levels.
Imports increase during the report week, with strong LNG sendout. Imports of natural gas from Canada increased again this week, averaging 7.3 Bcf/d over the report period. Pipeline imports into the Northeast increased by nearly a third, helping to meet demand in the region. Liquefied natural gas (LNG) sendout exceeded 2.2 Bcf last Thursday, including small volumes delivered from the Northeast Gateway floating LNG facility off the coast of Massachusetts, last week, marking its first delivery since March 2010, according to Bentek Energy data. This may have helped moderate prices in the Northeast.
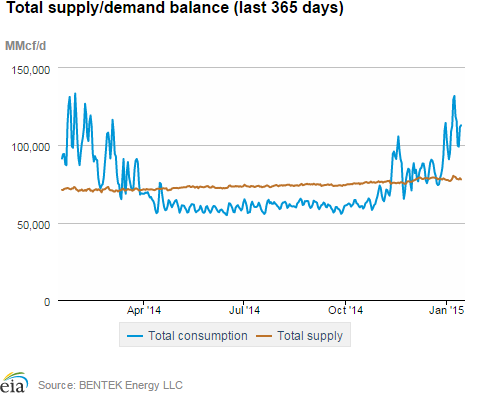
Demand increases overall for the week, moderating after Thursday. U.S. natural gas consumption averaged 111 Bcf/d for the report week, peaking on Thursday at 130 Bcf/d, and declining to the week's minimum of 97 Bcf/d on Monday. All sectors had increases in demand, with natural gas burned in the industrial and electric sectors each increasing by about 3% week-over-week. Gas consumption in the electric sector was mixed regionally, with the Midwest consuming 45% more gas over the period, and the Southwest consuming 17% less. Residential/commercial consumption increased by nearly 11%. Exports to Mexico were also elevated, up 15%. Exports to Mexico are expected to continue to grow in the future with the completion of the NGPL interconnect with the NET Mexico Pipeline.
Storage
Net withdrawal is larger than the five-year average, but lower than last year's withdrawal. The net withdrawal reported for the week ending January 9 was 236 Bcf, 46 Bcf larger than the five-year average net withdrawal for that week, and 32 Bcf lower than last year's net withdrawal. Working gas inventories as of January 9 totaled 2,853 Bcf, 282 Bcf (11.0%) higher than last year at this time and 113 Bcf (3.8%) lower than the five-year (2010-14) average.
Storage withdrawals are larger than market expectations. Market expectations called for an average pull of 227 Bcf. When the EIA storage report was released at 10:30 a.m. on January 15, the price for the February natural gas futures contract increased 3¢ to $3.31/MMBtu in trading on the Nymex. Within the next hour, prices fluctuated between $3.27 and $3.35/MMBtu.
Stocks in all three regions are above their year-ago levels. Storage levels for the East, West, and Producing regions were above their year-ago levels by 193 Bcf, 32 Bcf, and 58 Bcf, respectively, but they remain below their five-year average levels. The East, West, and Producing regions had net withdrawals of 127 Bcf (19 Bcf higher than its five-year average withdrawal), 28 Bcf (6 Bcf higher), and 81 Bcf (21 Bcf higher), respectively.
Temperatures during the storage report week are cooler than normal. Temperatures in the Lower 48 states averaged 31° for the storage report week, 2.3° cooler than the 30-year normal temperature and 5.1° warmer than the temperatures during the same week last year. There were 240 population-weighted heating degree days during the storage report week, 16 more than the 30-year normal and 35 fewer than during the same period last year.
See also:

| Spot Prices ($/MMBtu) | Thu, 08-Jan |
Fri, 09-Jan |
Mon, 12-Jan |
Tue, 13-Jan |
Wed, 14-Jan |
|---|---|---|---|---|---|
| Henry Hub |
2.91 |
2.95 |
2.90 |
2.89 |
3.13 |
| New York |
8.64 |
11.35 |
9.91 |
4.81 |
4.67 |
| Chicago |
3.17 |
3.06 |
3.00 |
2.96 |
3.15 |
| Cal. Comp. Avg,* |
2.97 |
3.00 |
2.97 |
2.96 |
3.14 |
| Futures ($/MMBtu) | |||||
| February contract |
2.927 |
2.946 |
2.795 |
2.943 |
3.233 |
| March contract |
2.925 |
2.947 |
2.795 |
2.932 |
3.208 |
| *Avg. of NGI's reported prices for: Malin, PG&E citygate, and Southern California Border Avg. | |||||
| Source: NGI's Daily Gas Price Index | |||||
| U.S. natural gas supply - Gas Week: (1/7/15 - 1/14/15) | ||
|---|---|---|
Percent change for week compared with: |
||
last year |
last week |
|
| Gross production | 10.11%
|
-0.28%
|
| Dry production | 10.01%
|
-0.28%
|
| Canadian imports | 22.85%
|
7.85%
|
| West (net) | 6.67%
|
2.42%
|
| Midwest (net) | 33.16%
|
3.10%
|
| Northeast (net) | 46.77%
|
31.14%
|
| LNG imports | 554.40%
|
84.23%
|
| Total supply | 12.20%
|
0.97%
|
| Source: BENTEK Energy LLC | ||
| U.S. consumption - Gas Week: (1/7/15 - 1/14/15) | ||
|---|---|---|
Percent change for week compared with: |
||
last year |
last week |
|
| U.S. consumption | 29.8%
|
6.9%
|
| Power | 36.2%
|
2.8%
|
| Industrial | 6.9%
|
2.5%
|
| Residential/commercial | 38.8%
|
10.6%
|
| Total demand | 29.7%
|
7.0%
|
| Source: BENTEK Energy LLC | ||
| Rigs | |||
|---|---|---|---|
Fri, January 09, 2015 |
Change from |
||
last week |
last year |
||
| Oil rigs | 1,421 |
-4.12% |
2.01% |
| Natural gas rigs | 329 |
0.30% |
-7.84% |
| Miscellaneous | 0 |
-100.00% |
-100.00% |
| Rig numbers by type | |||
|---|---|---|---|
Fri, January 09, 2015 |
Change from |
||
last week |
last year |
||
| Vertical | 288 |
-4.00% |
-22.58% |
| Horizontal | 1,301 |
-2.62% |
12.35% |
| Directional | 161 |
-8.00% |
-28.13% |
| Source: Baker Hughes Inc. | |||
| Working gas in underground storage | ||||
|---|---|---|---|---|
Stocks billion cubic feet (bcf) |
||||
| Region | 2015-01-09 |
2015-01-02 |
change |
|
| East | 1,468 |
1,595 |
-127 |
|
| West | 400 |
428 |
-28 |
|
| Producing | 985 |
1,066 |
-81 |
|
| Total | 2,853 |
3,089 |
-236 |
|
| Source: U.S. Energy Information Administration | ||||
| Working gas in underground storage | |||||
|---|---|---|---|---|---|
Historical comparisons |
|||||
Year ago (1/9/14) |
5-year average (2010-2014) |
||||
| Region | Stocks (Bcf) |
% change |
Stocks (Bcf) |
% change |
|
| East | 1,275 |
15.1 |
1,523 |
-3.6 |
|
| West | 368 |
8.7 |
413 |
-3.1 |
|
| Producing | 927 |
6.3 |
1,030 |
-4.4 |
|
| Total | 2,571 |
11.0 |
2,966 |
-3.8 |
|
| Source: U.S. Energy Information Administration | |||||
| Temperature -- heating & cooling degree days (week ending Jan 08) | ||||||||
|---|---|---|---|---|---|---|---|---|
HDD deviation from: |
CDD deviation from: |
|||||||
| Region | HDD Current |
normal |
last year |
CDD Current |
normal |
last year |
||
| New England | 280
|
11
|
-47
|
0
|
0
|
0
|
||
| Middle Atlantic | 272
|
15
|
-53
|
0
|
0
|
0
|
||
| E N Central | 331
|
38
|
-58
|
0
|
0
|
0
|
||
| W N Central | 366
|
50
|
-39
|
0
|
0
|
0
|
||
| South Atlantic | 177
|
-4
|
-61
|
11
|
4
|
6
|
||
| E S Central | 193
|
5
|
-70
|
0
|
-2
|
0
|
||
| W S Central | 179
|
39
|
-13
|
0
|
-3
|
0
|
||
| Mountain | 241
|
5
|
3
|
0
|
0
|
0
|
||
| Pacific | 100
|
-25
|
13
|
0
|
0
|
0
|
||
| United States | 240
|
16
|
-35
|
2
|
0
|
1
|
||
|
Note: HDD = heating degree-day; CDD = cooling degree-day Source: National Oceanic and Atmospheric Administration | ||||||||
Average temperature (°F)
7-Day Mean ending Jan 08, 2015
Source: NOAA/National Weather Service
Deviation between average and normal (°F)
7-Day Mean ending Jan 08, 2015
Source: NOAA/National Weather Service