|
|
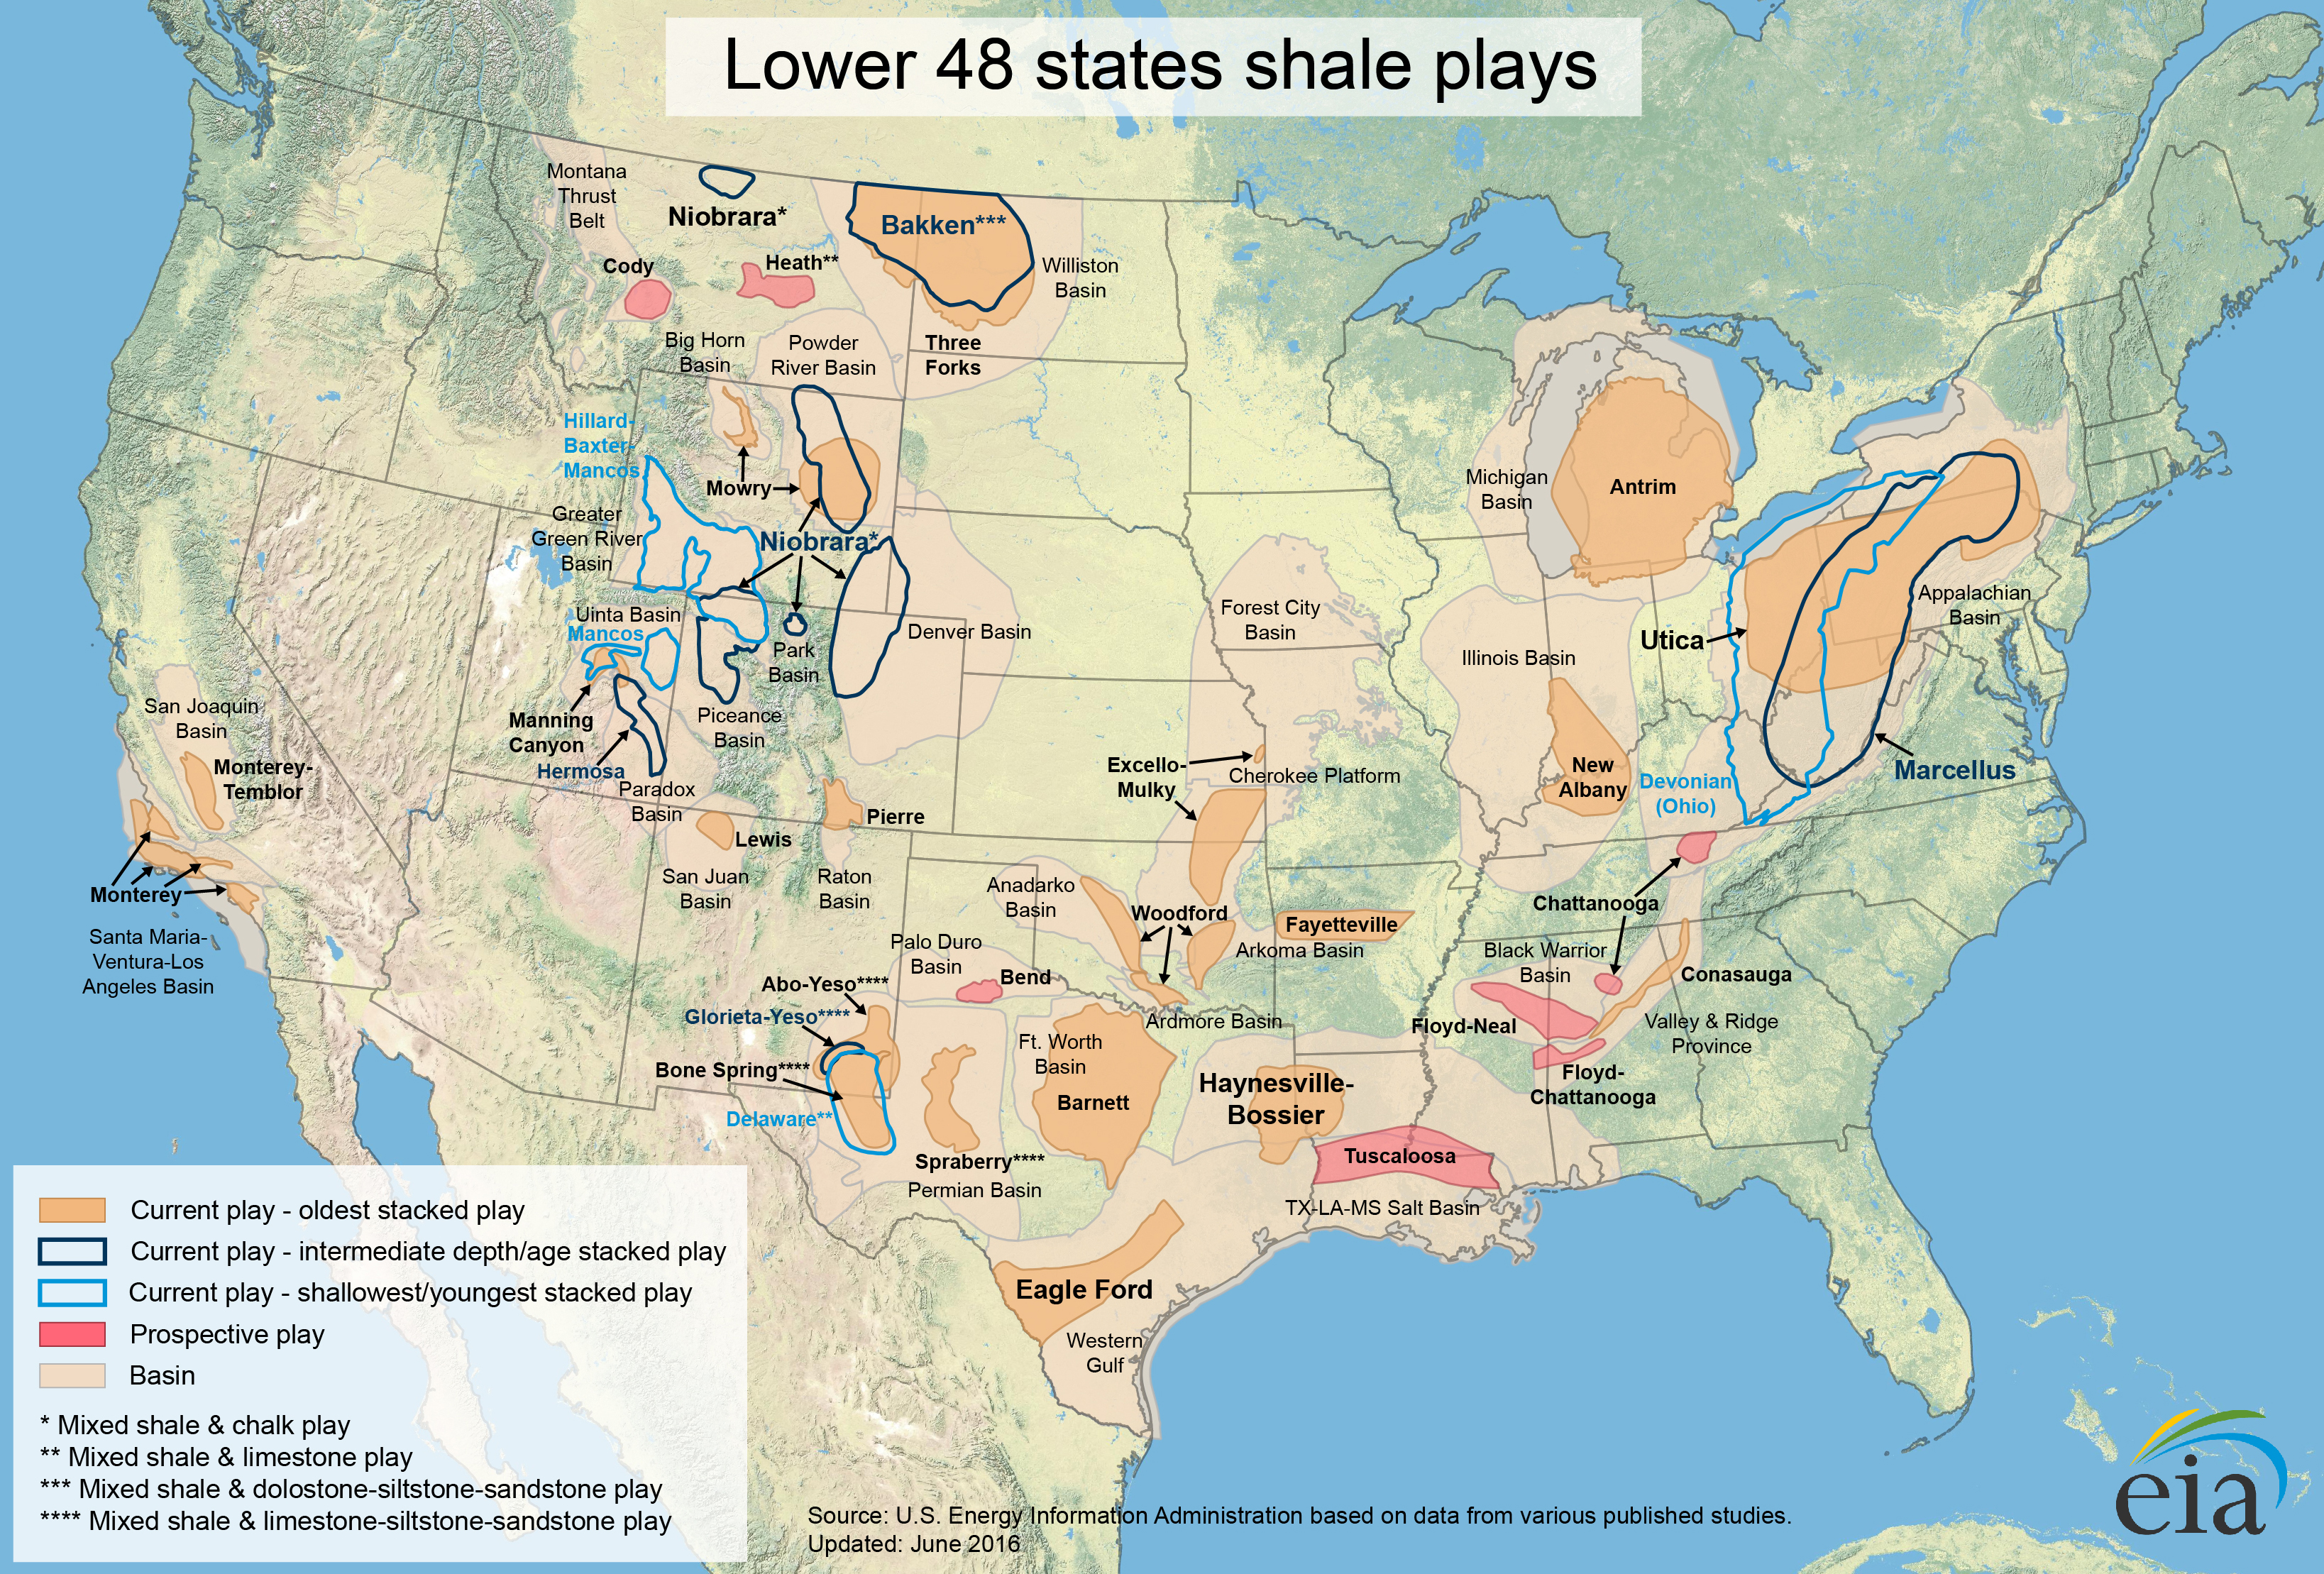
The following maps show the drilling history and oil and gas production of selected low-permeability, continuous-type shale reservoirs. Selected geologic characteristics pertinent to occurrence of producible oil and gas resources are also shown when available.
|
U.S. and lower 48 states
- Lower 48 states shale plays (4/13/2015) PDF
Map data
- Low permeability oil and gas play boundaries in Lower 48 States (10/8/2019) Shapefile
- Sedimentary basin boundaries in Lower 48 States (3/11/2016) Shapefile
|
Anadarko Basin, Oklahoma and Texas
- Granite Wash Play (11/9/2010) PDF
- Woodford Shale Play (6/1/2011) PDF
|
Ardmore Basin, Oklahoma and Texas
- Woodford Shale Play (6/1/2011) PDF
|
| Arkoma Basin
|
Appalachian Basin
- Marcellus Play Report: geology review and map updates (2/10/2017) PDF
- Marcellus Play updates (2/8/2015) PDF
- related article — Updated geologic maps provide greater detail for Marcellus formation, Today in Energy, 4/1/15
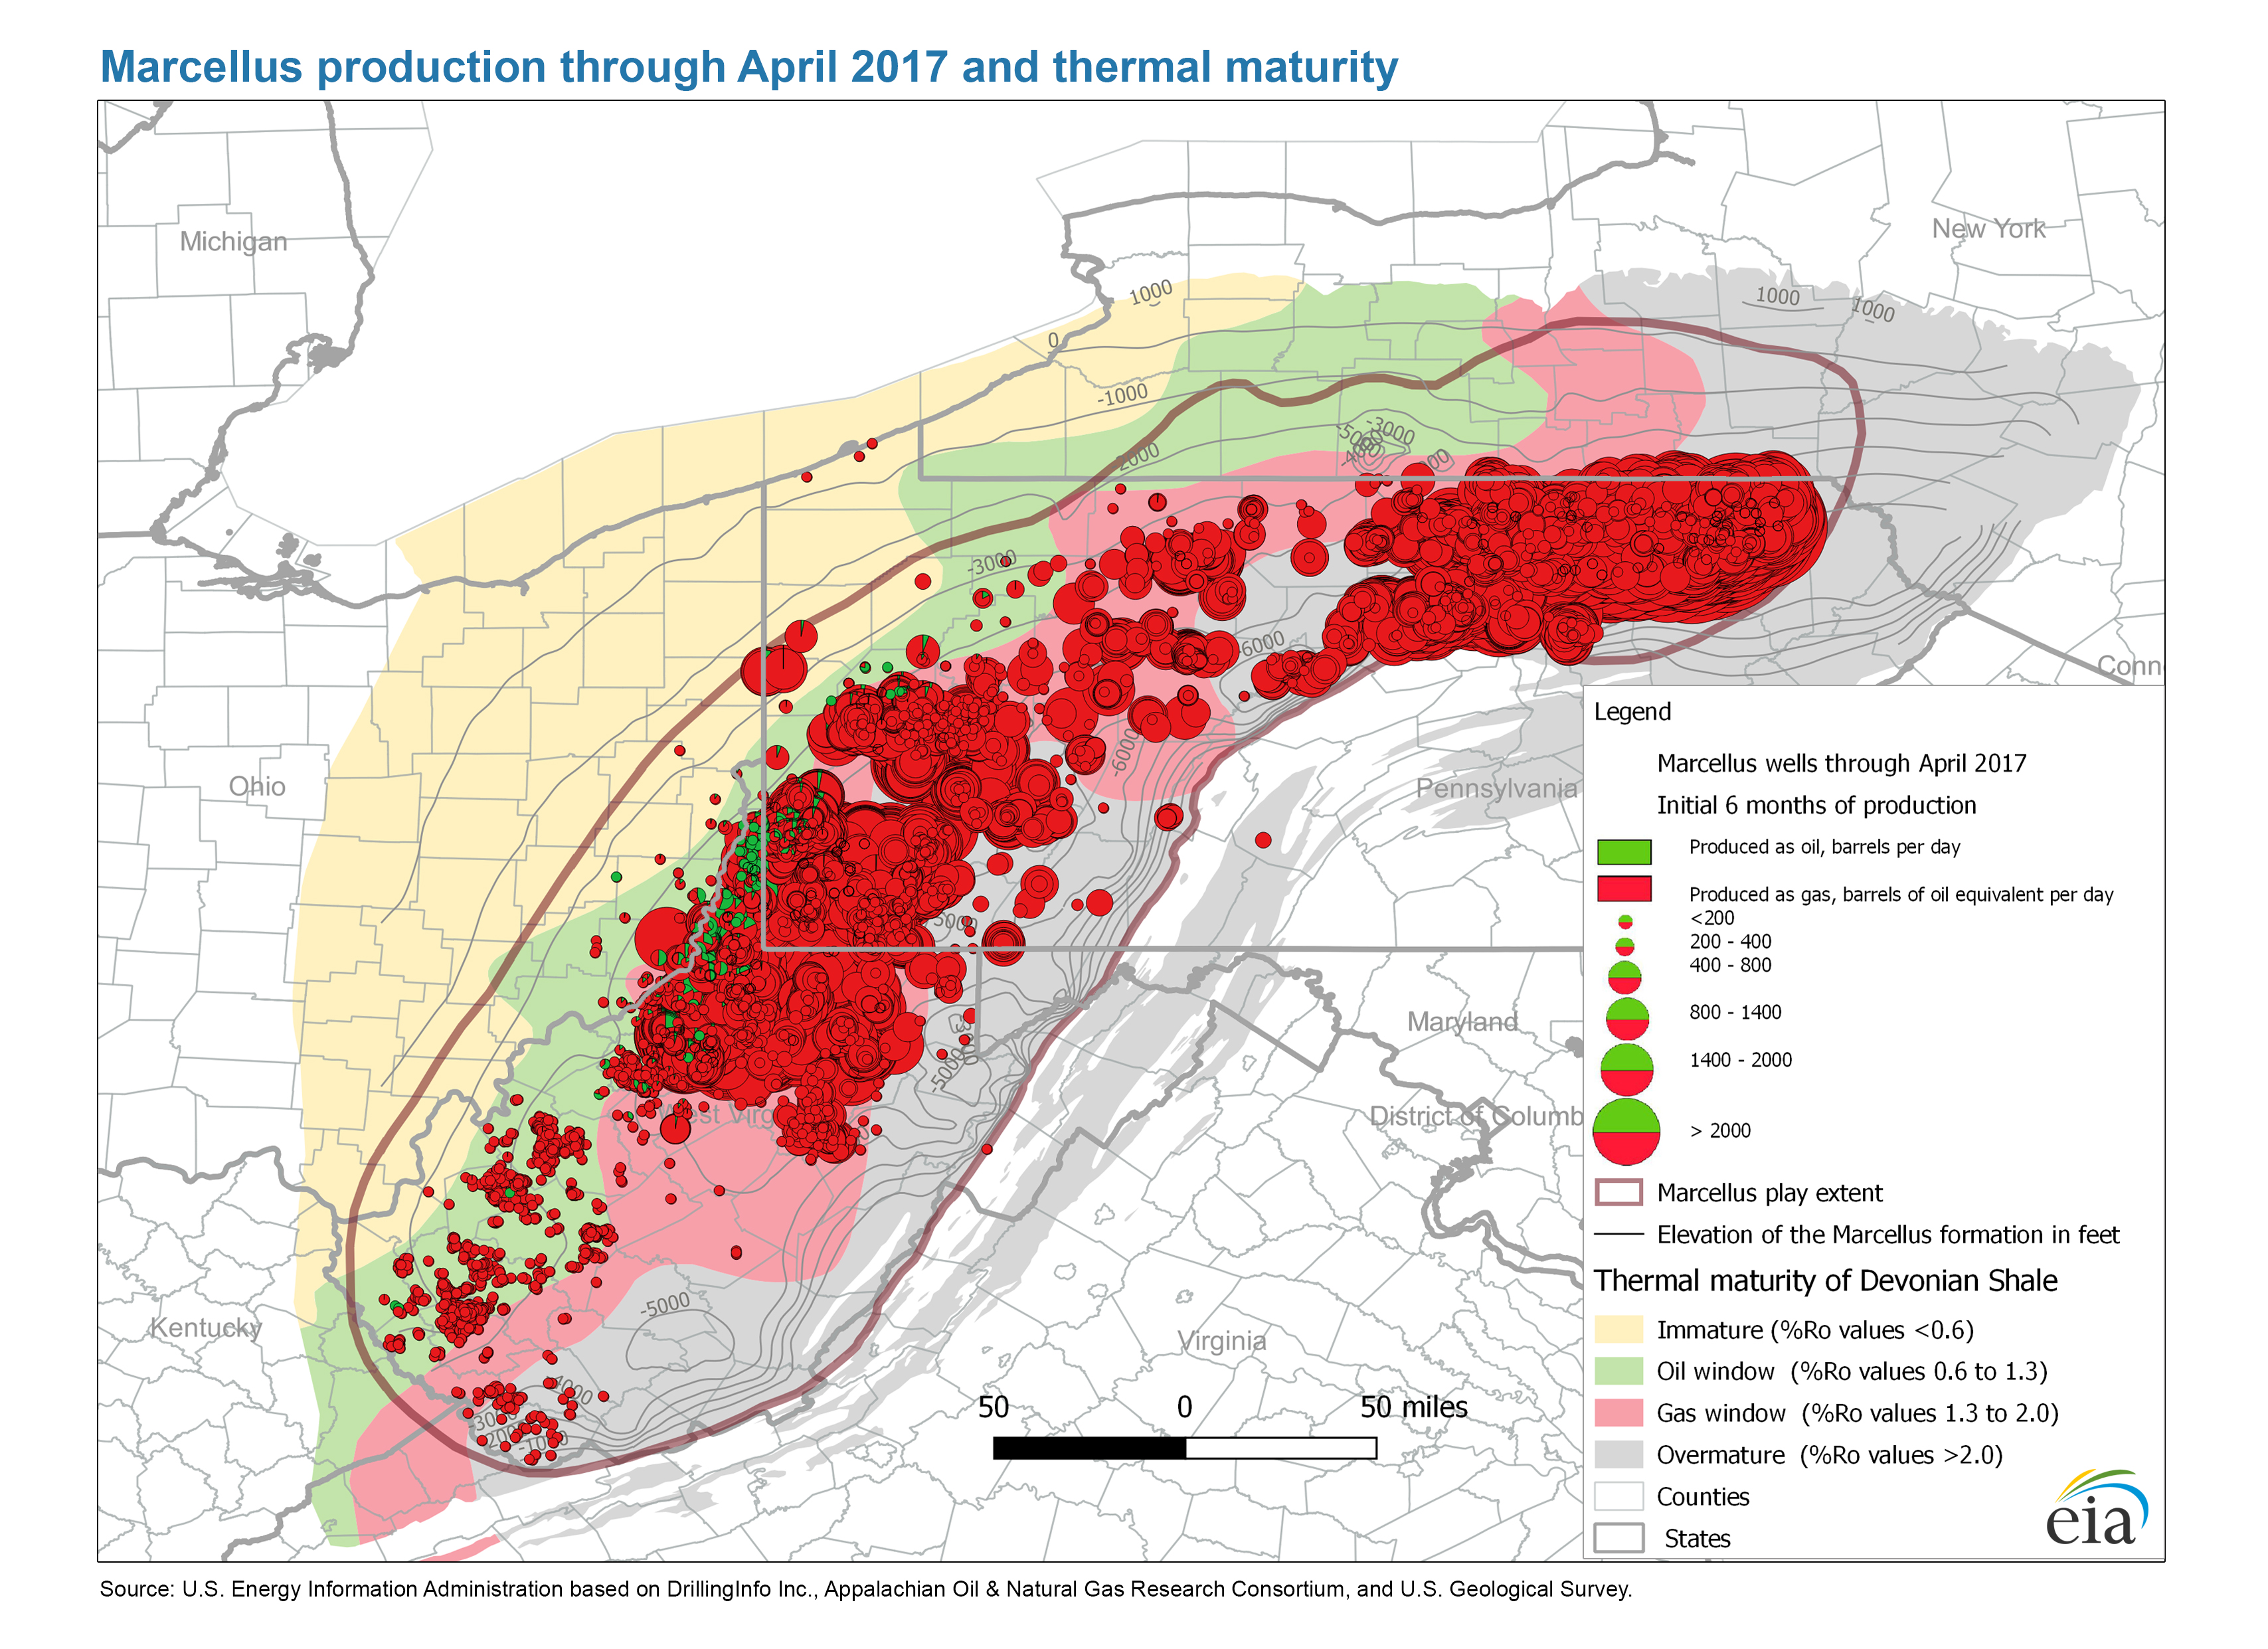
- Marcellus production through April 2017 and thermal maturity (4/20/2017) PDF JPG
- Marcellus Shale Play, Appalachian Basin (6/1/2011) PDF
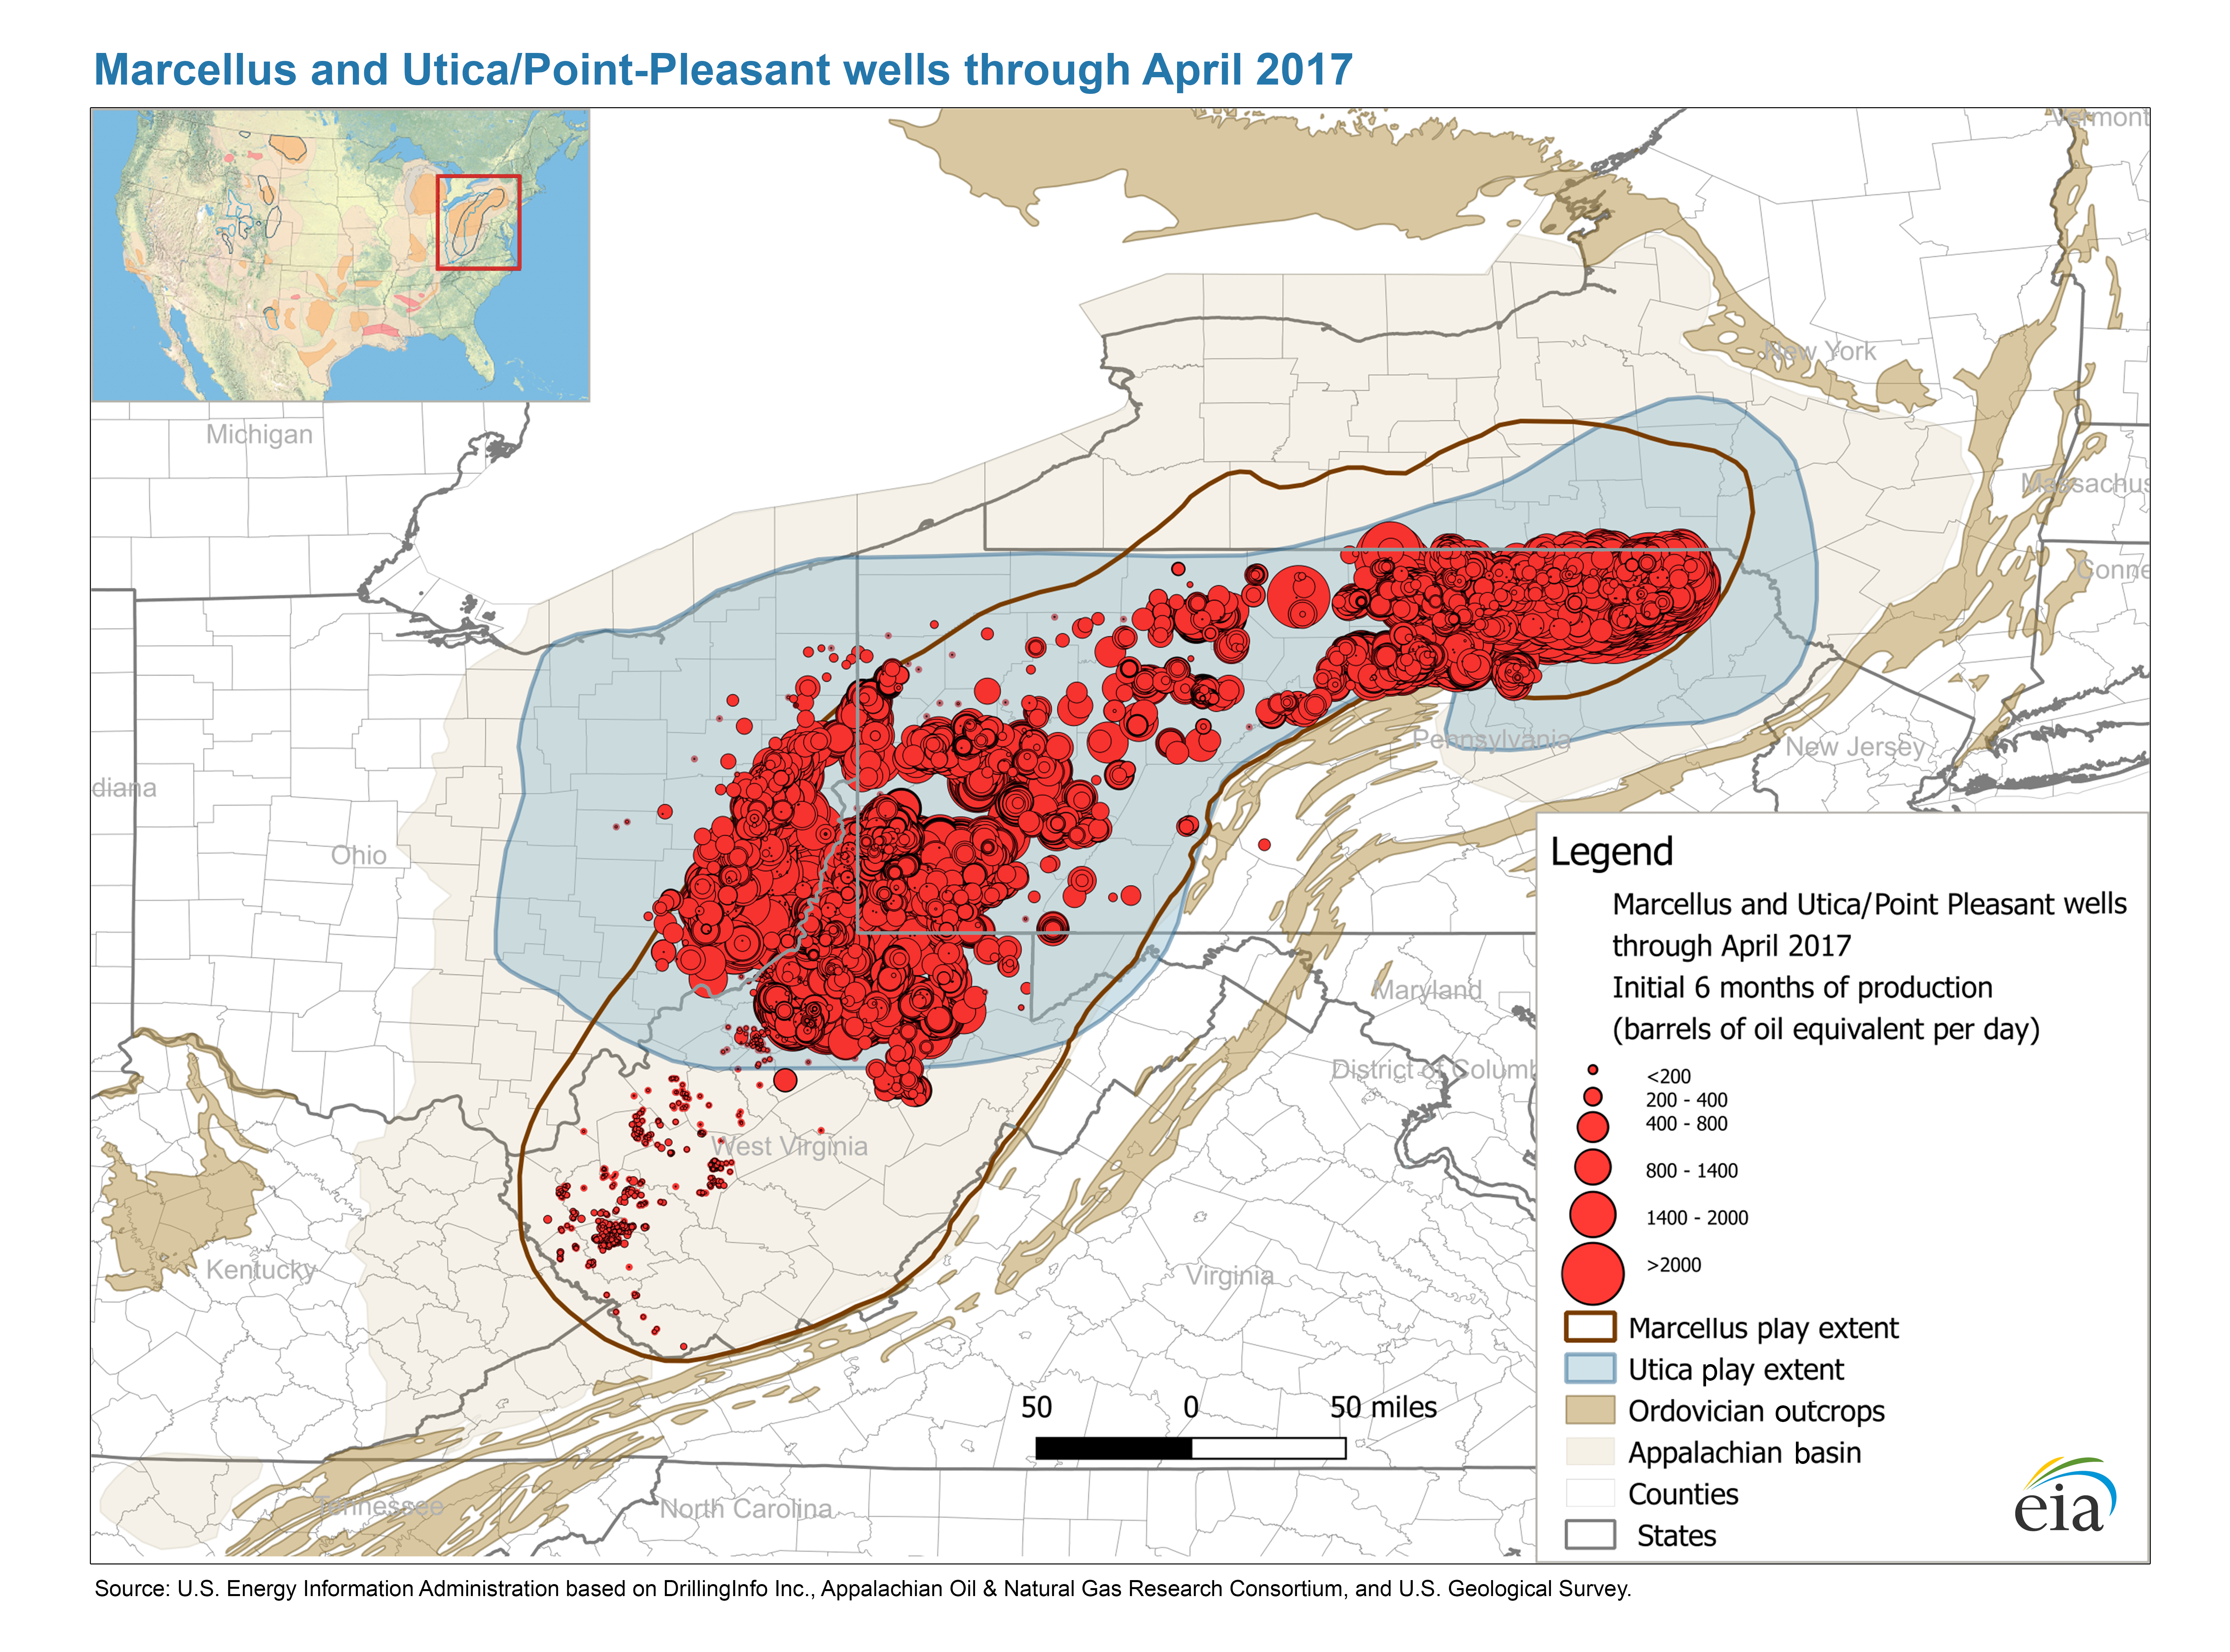
- Marcellus and Utica/Point-Pleasant wells through April 2017 (4/18/2017) PDF JPG
- Utica Play Report: geology review and map updates (4/7/2017) PDF
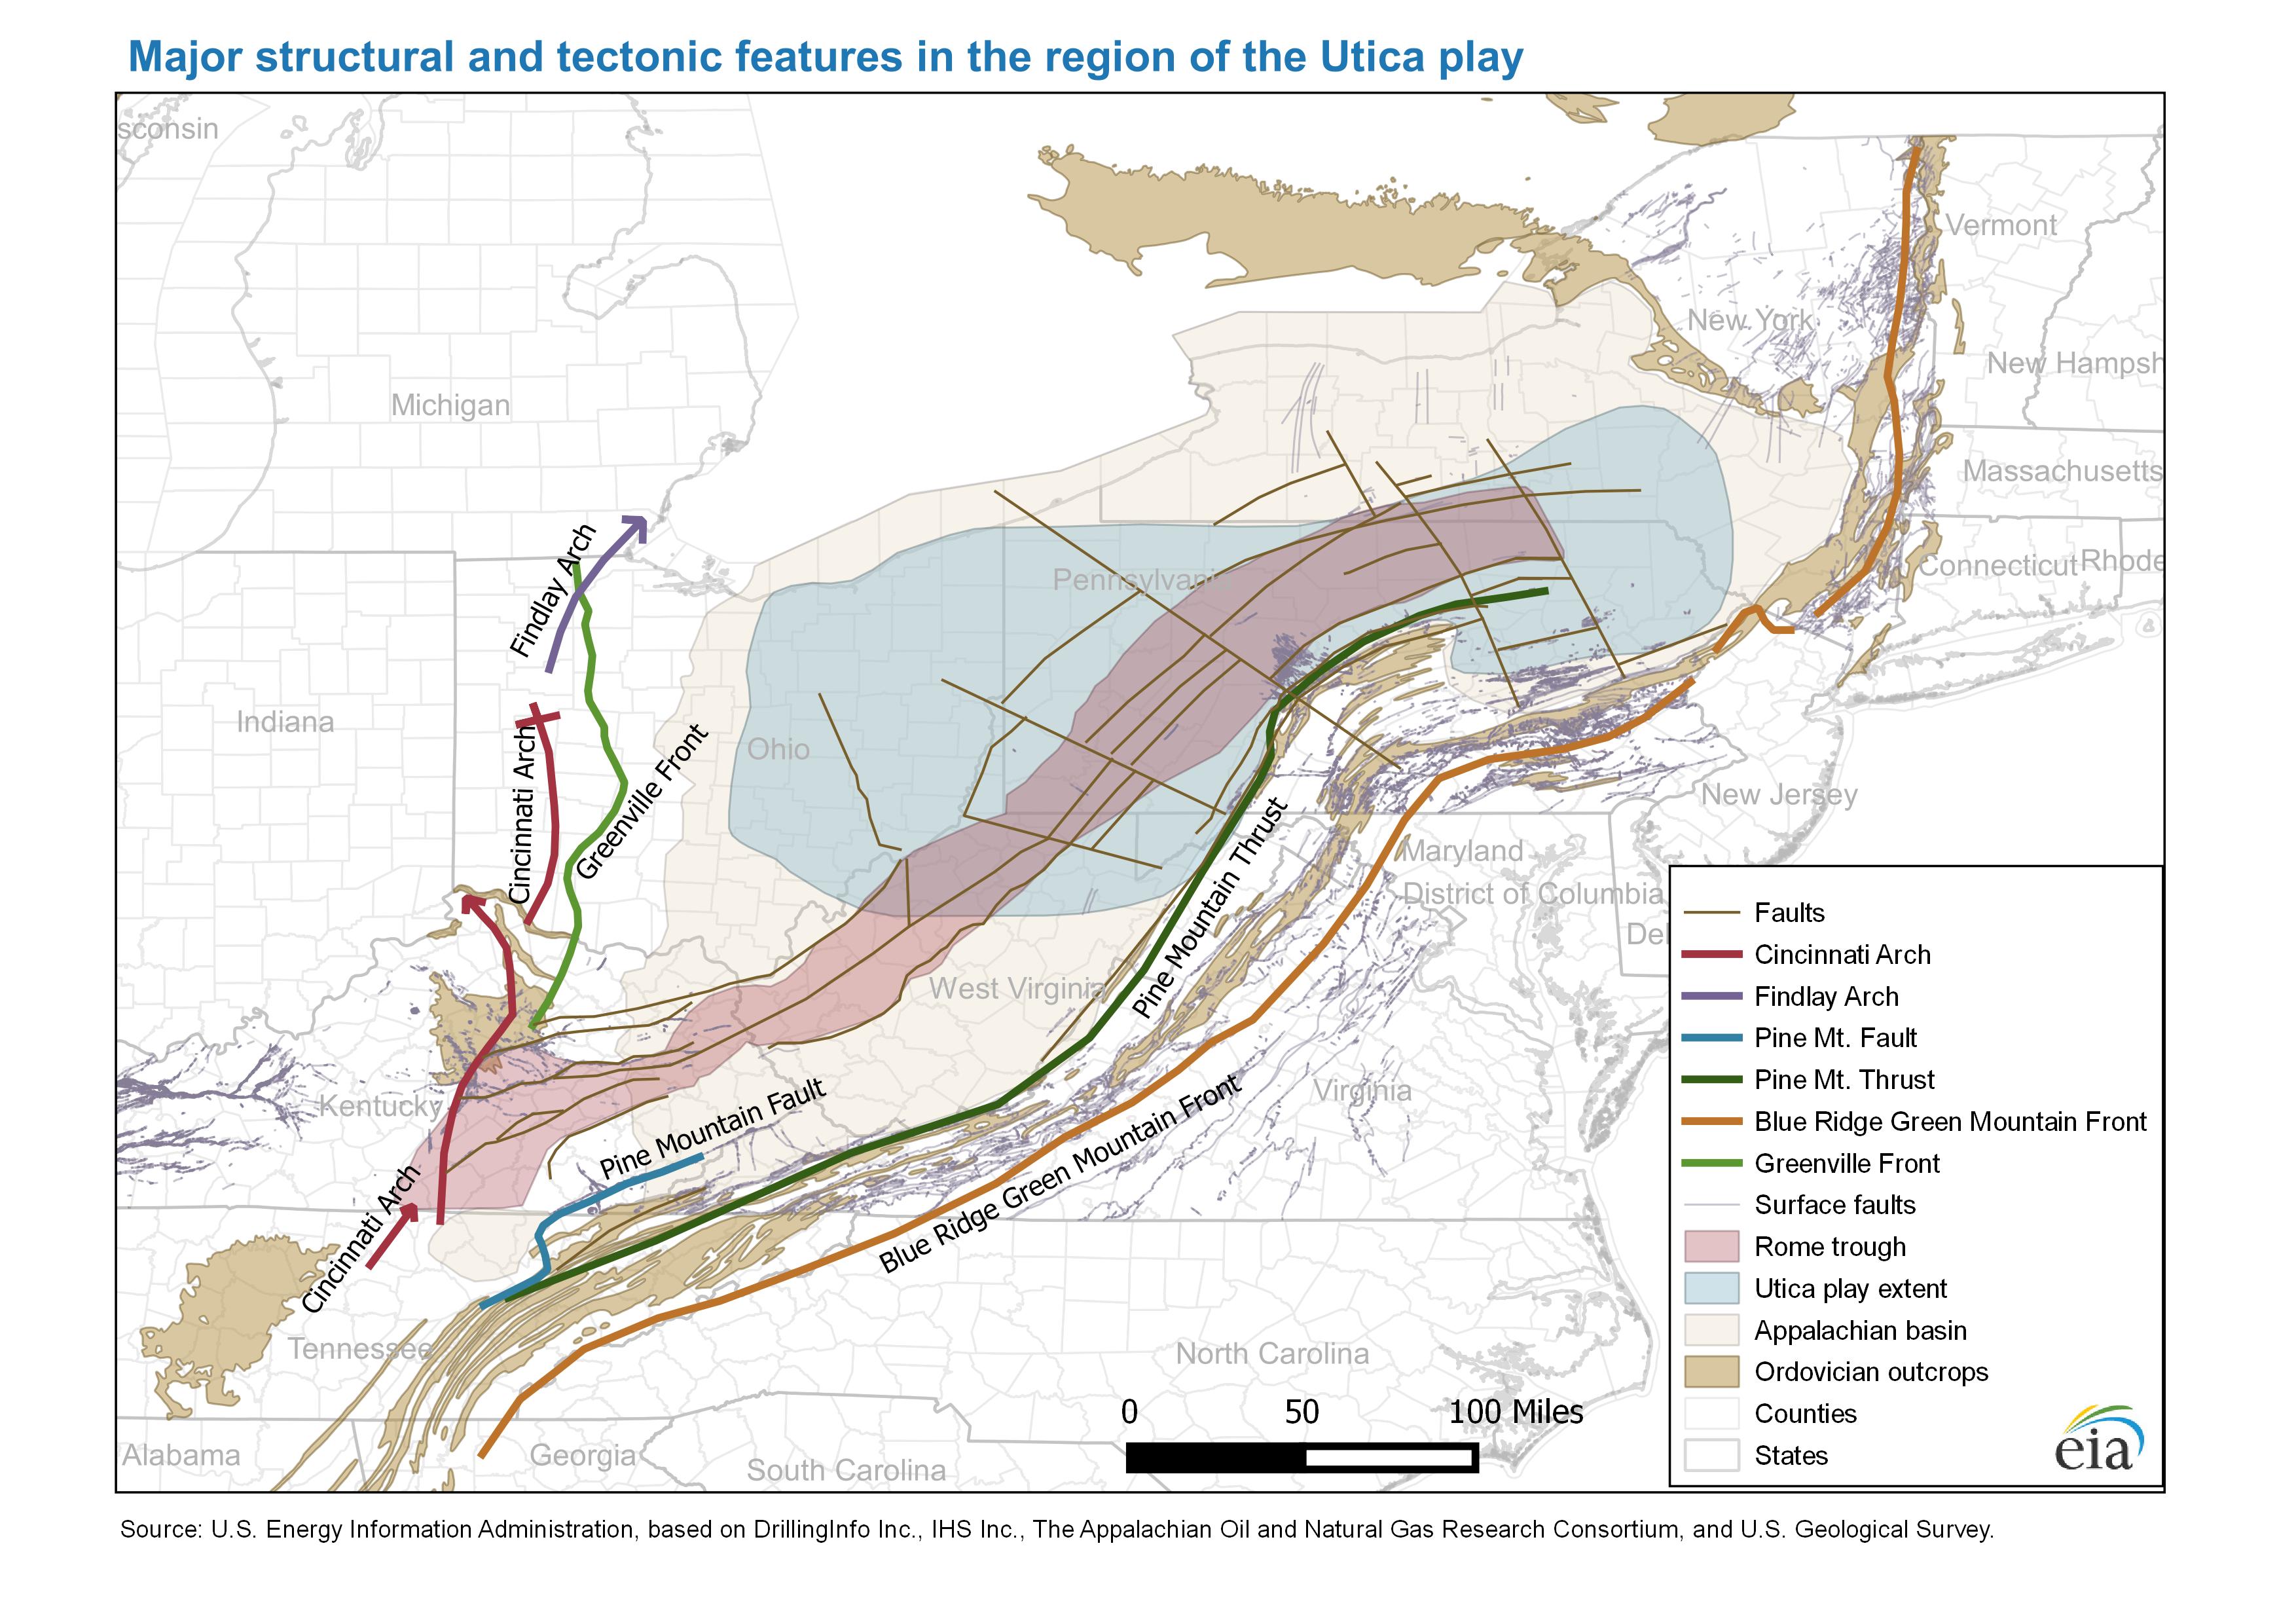
- Major structure map and tectonic features in the region of the Utica play (4/19/2016) PDF JPG
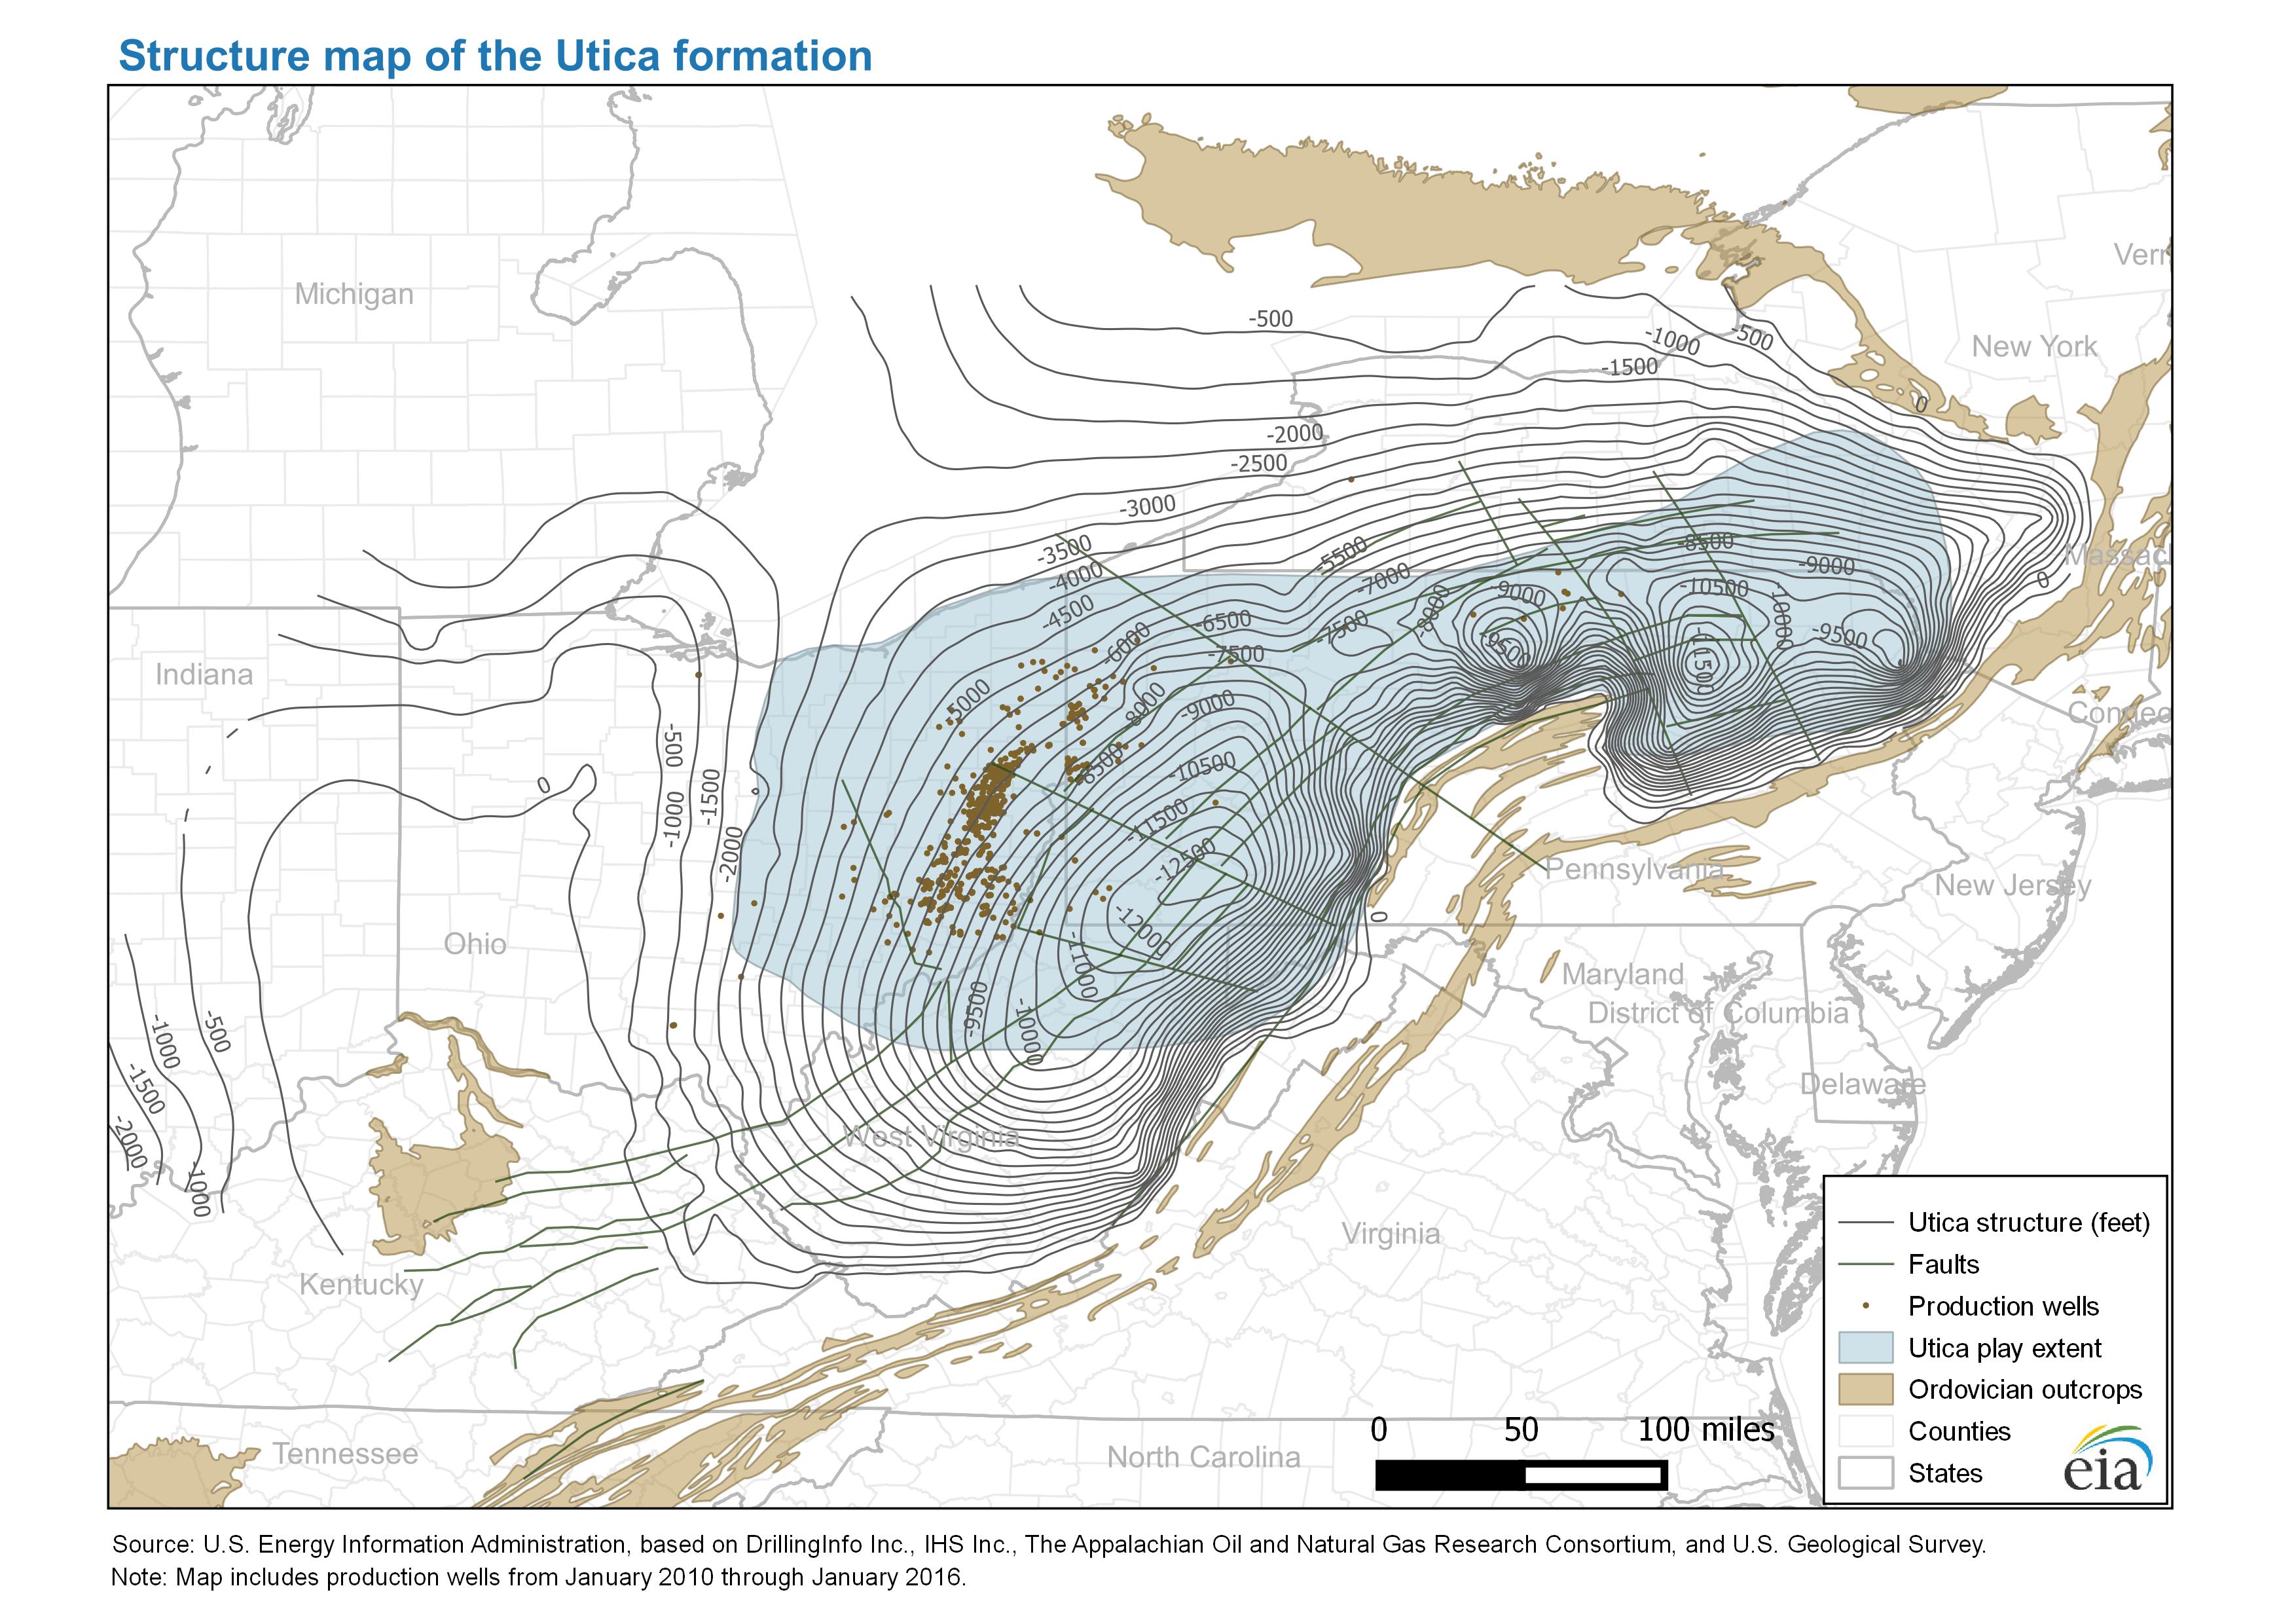
- Structure map of the Utica formation (4/19/2016) PDF JPG
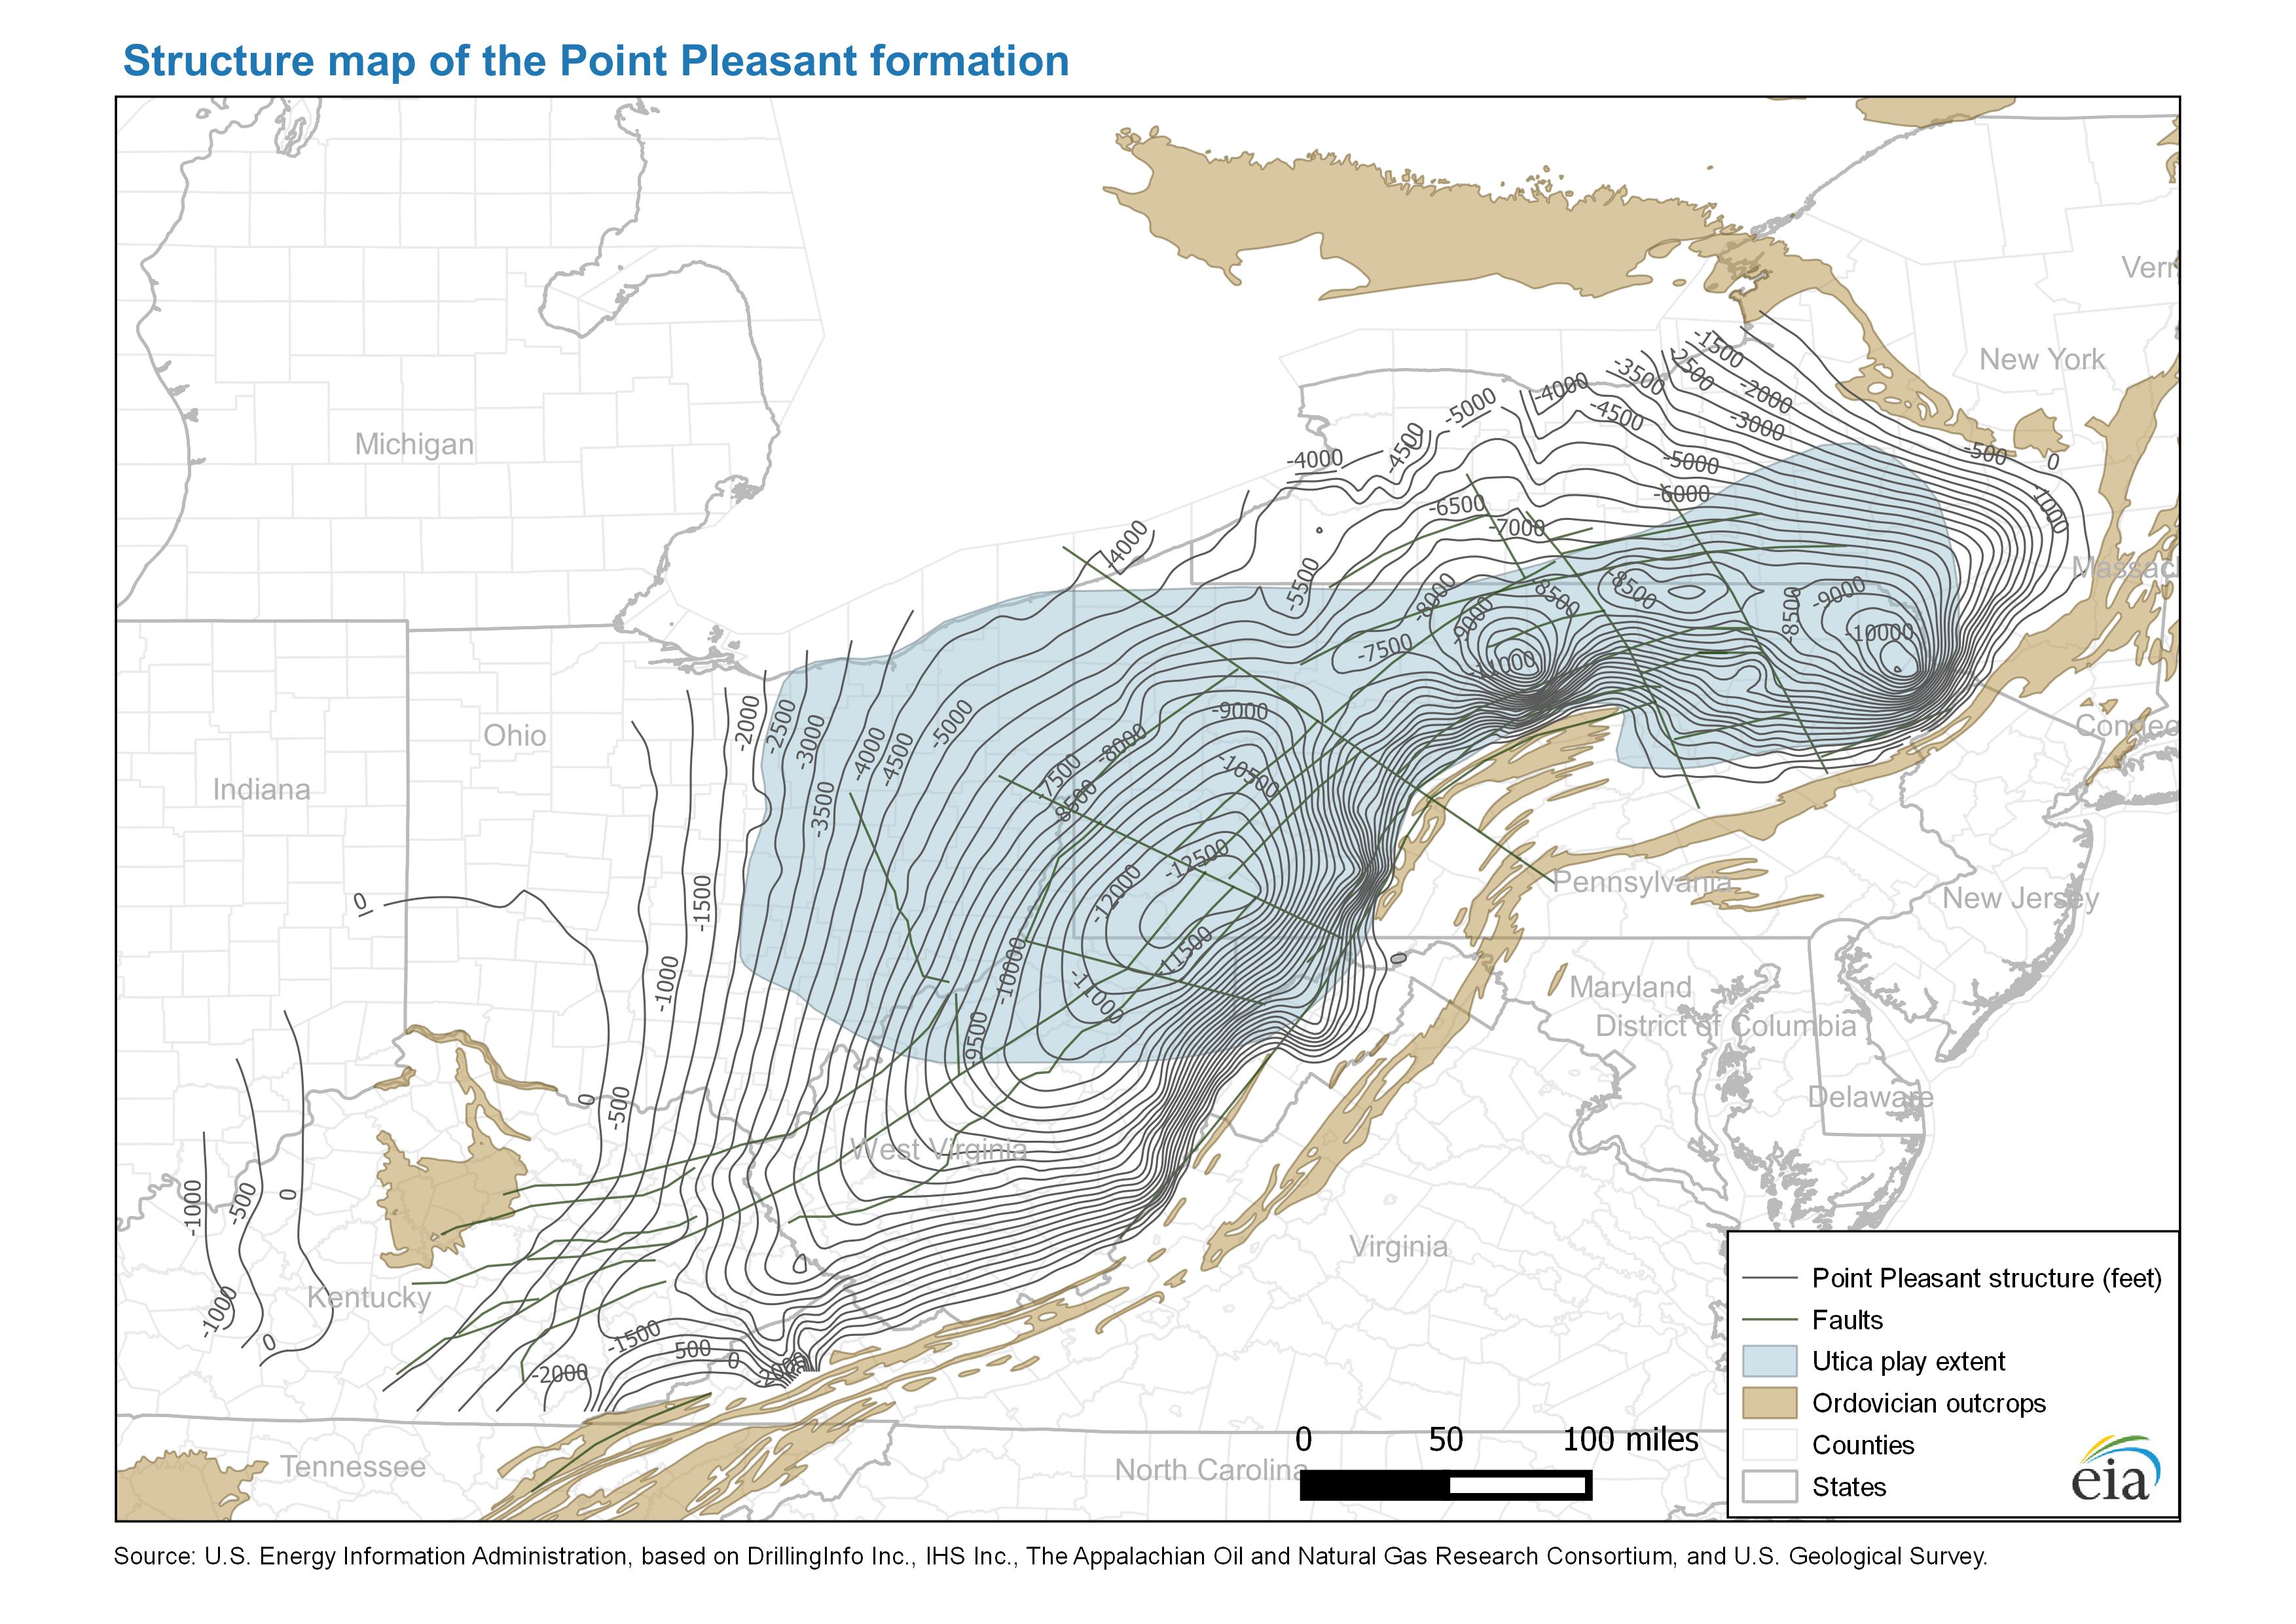
- Structure map of the Point Pleasant formation (4/19/2016) PDF JPG
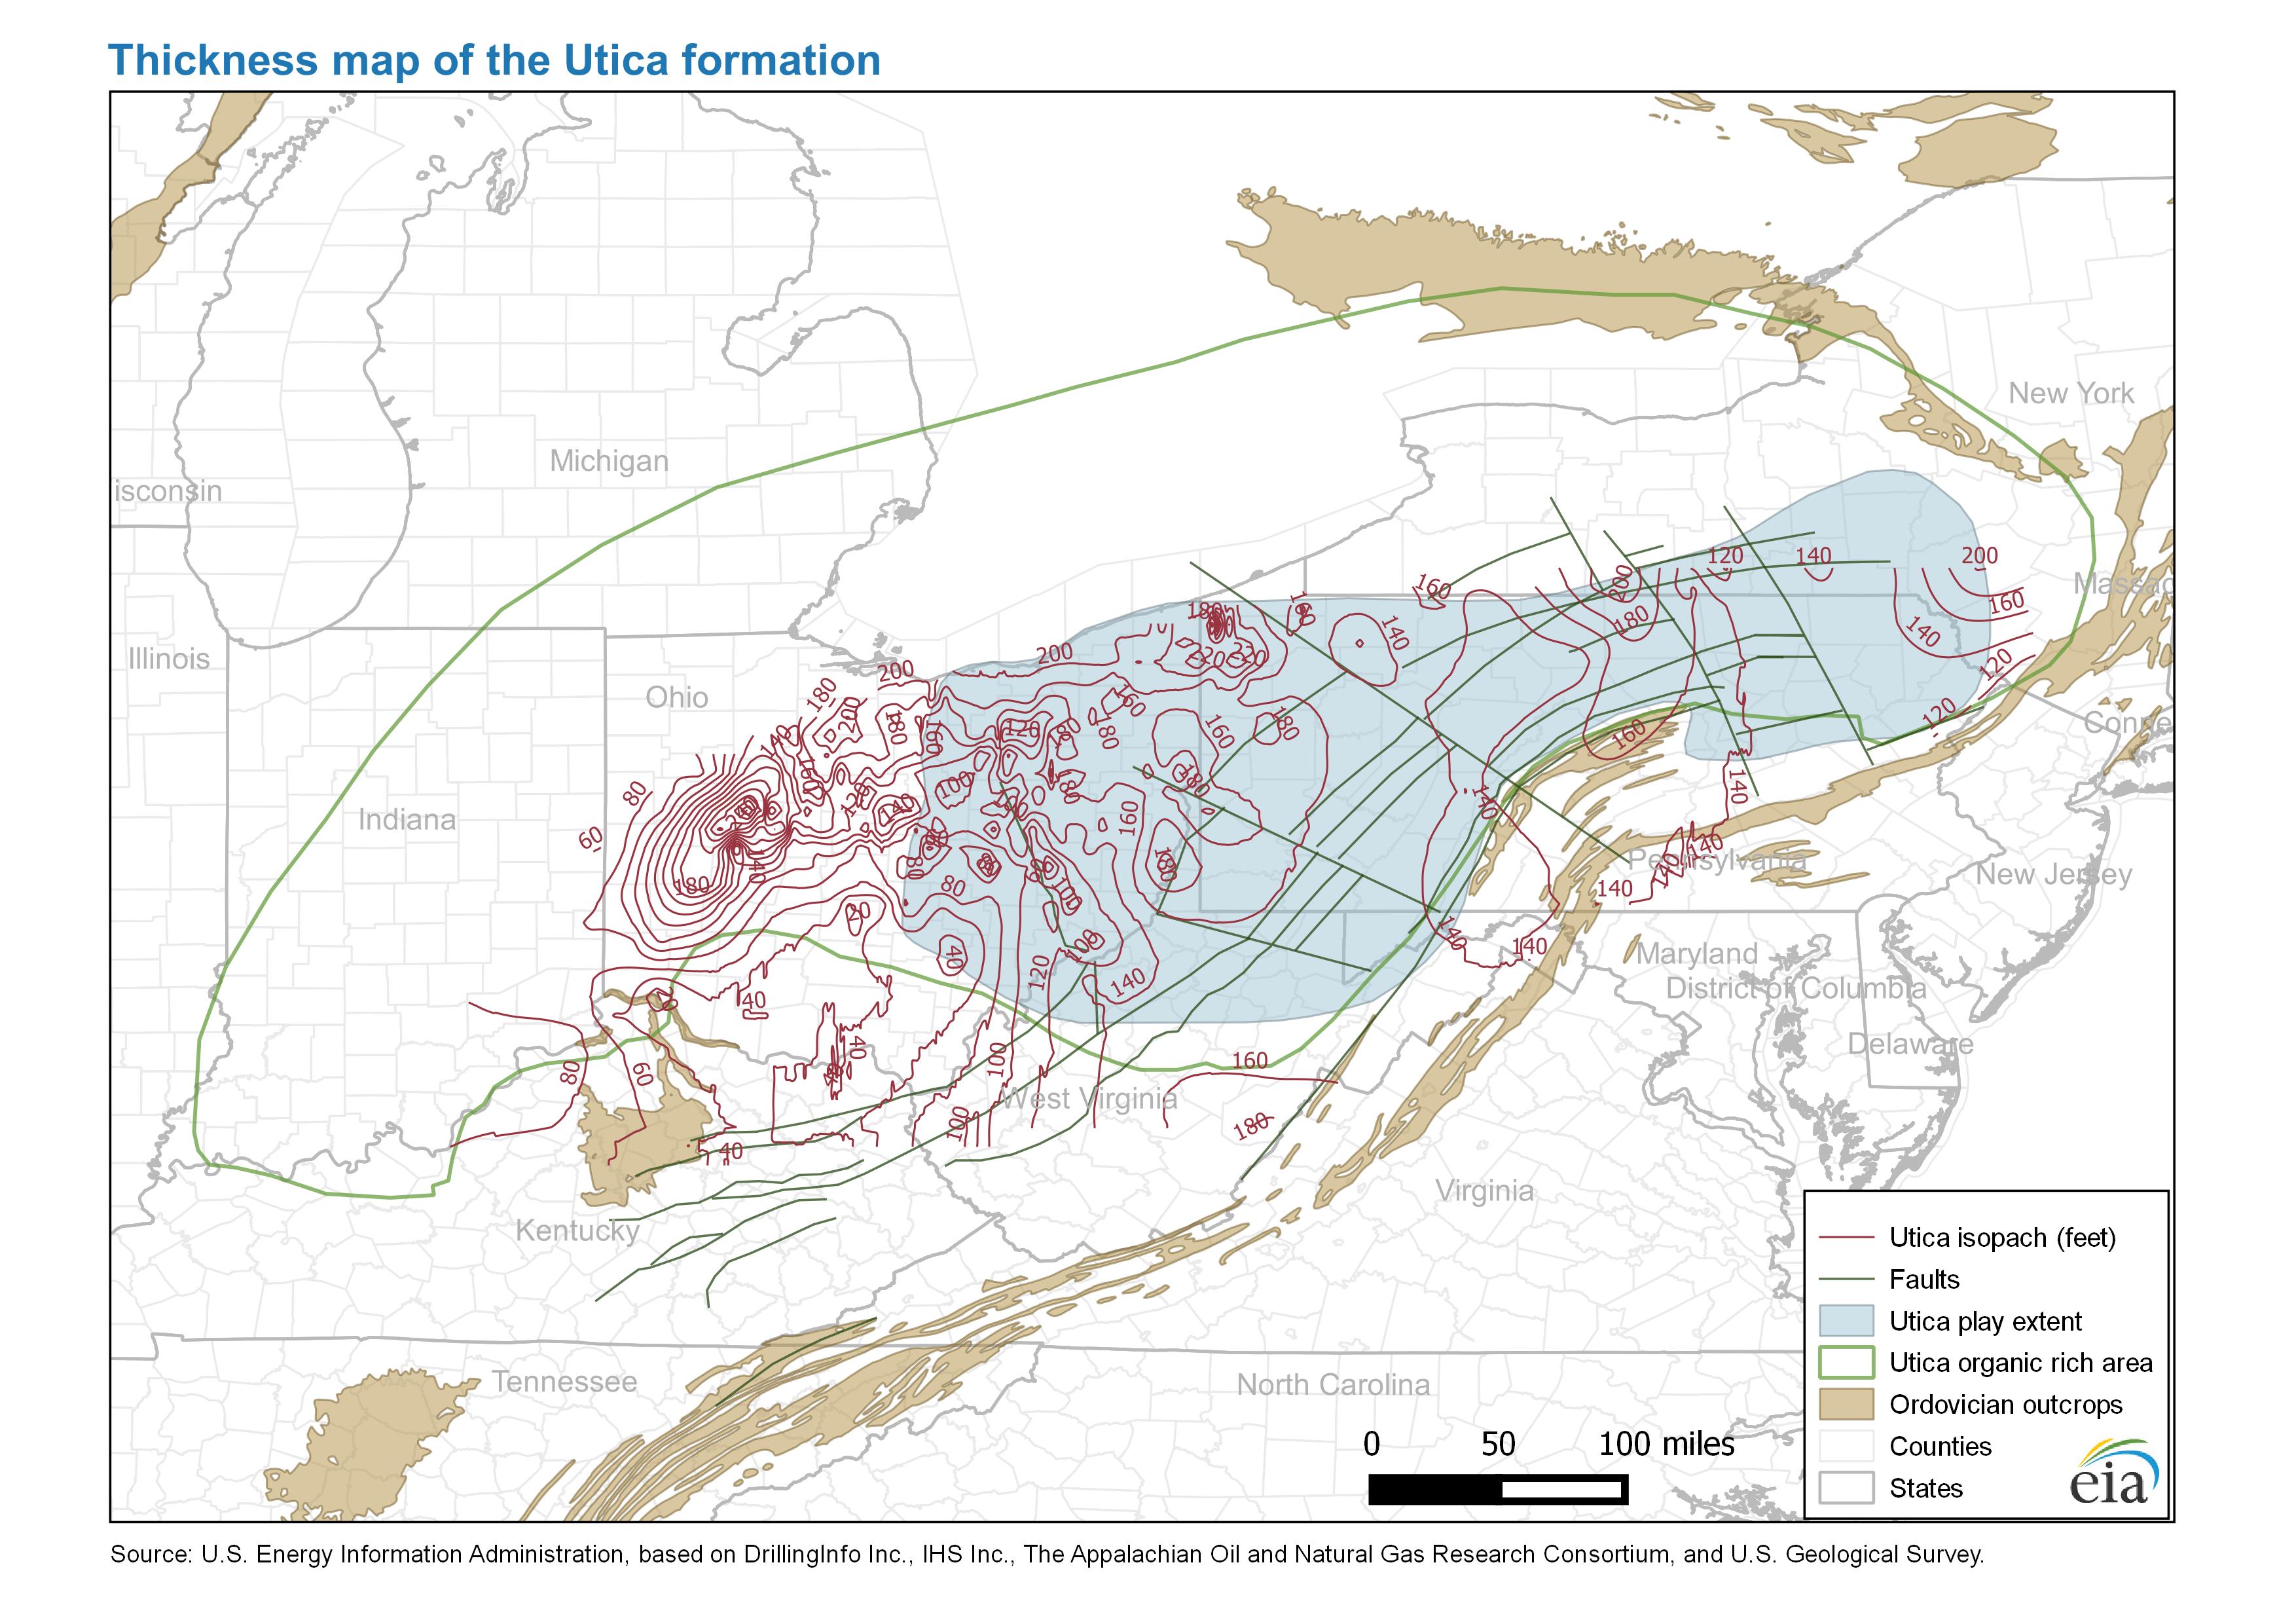
- Thickness map of the Utica formation (4/19/2016) PDF JPG
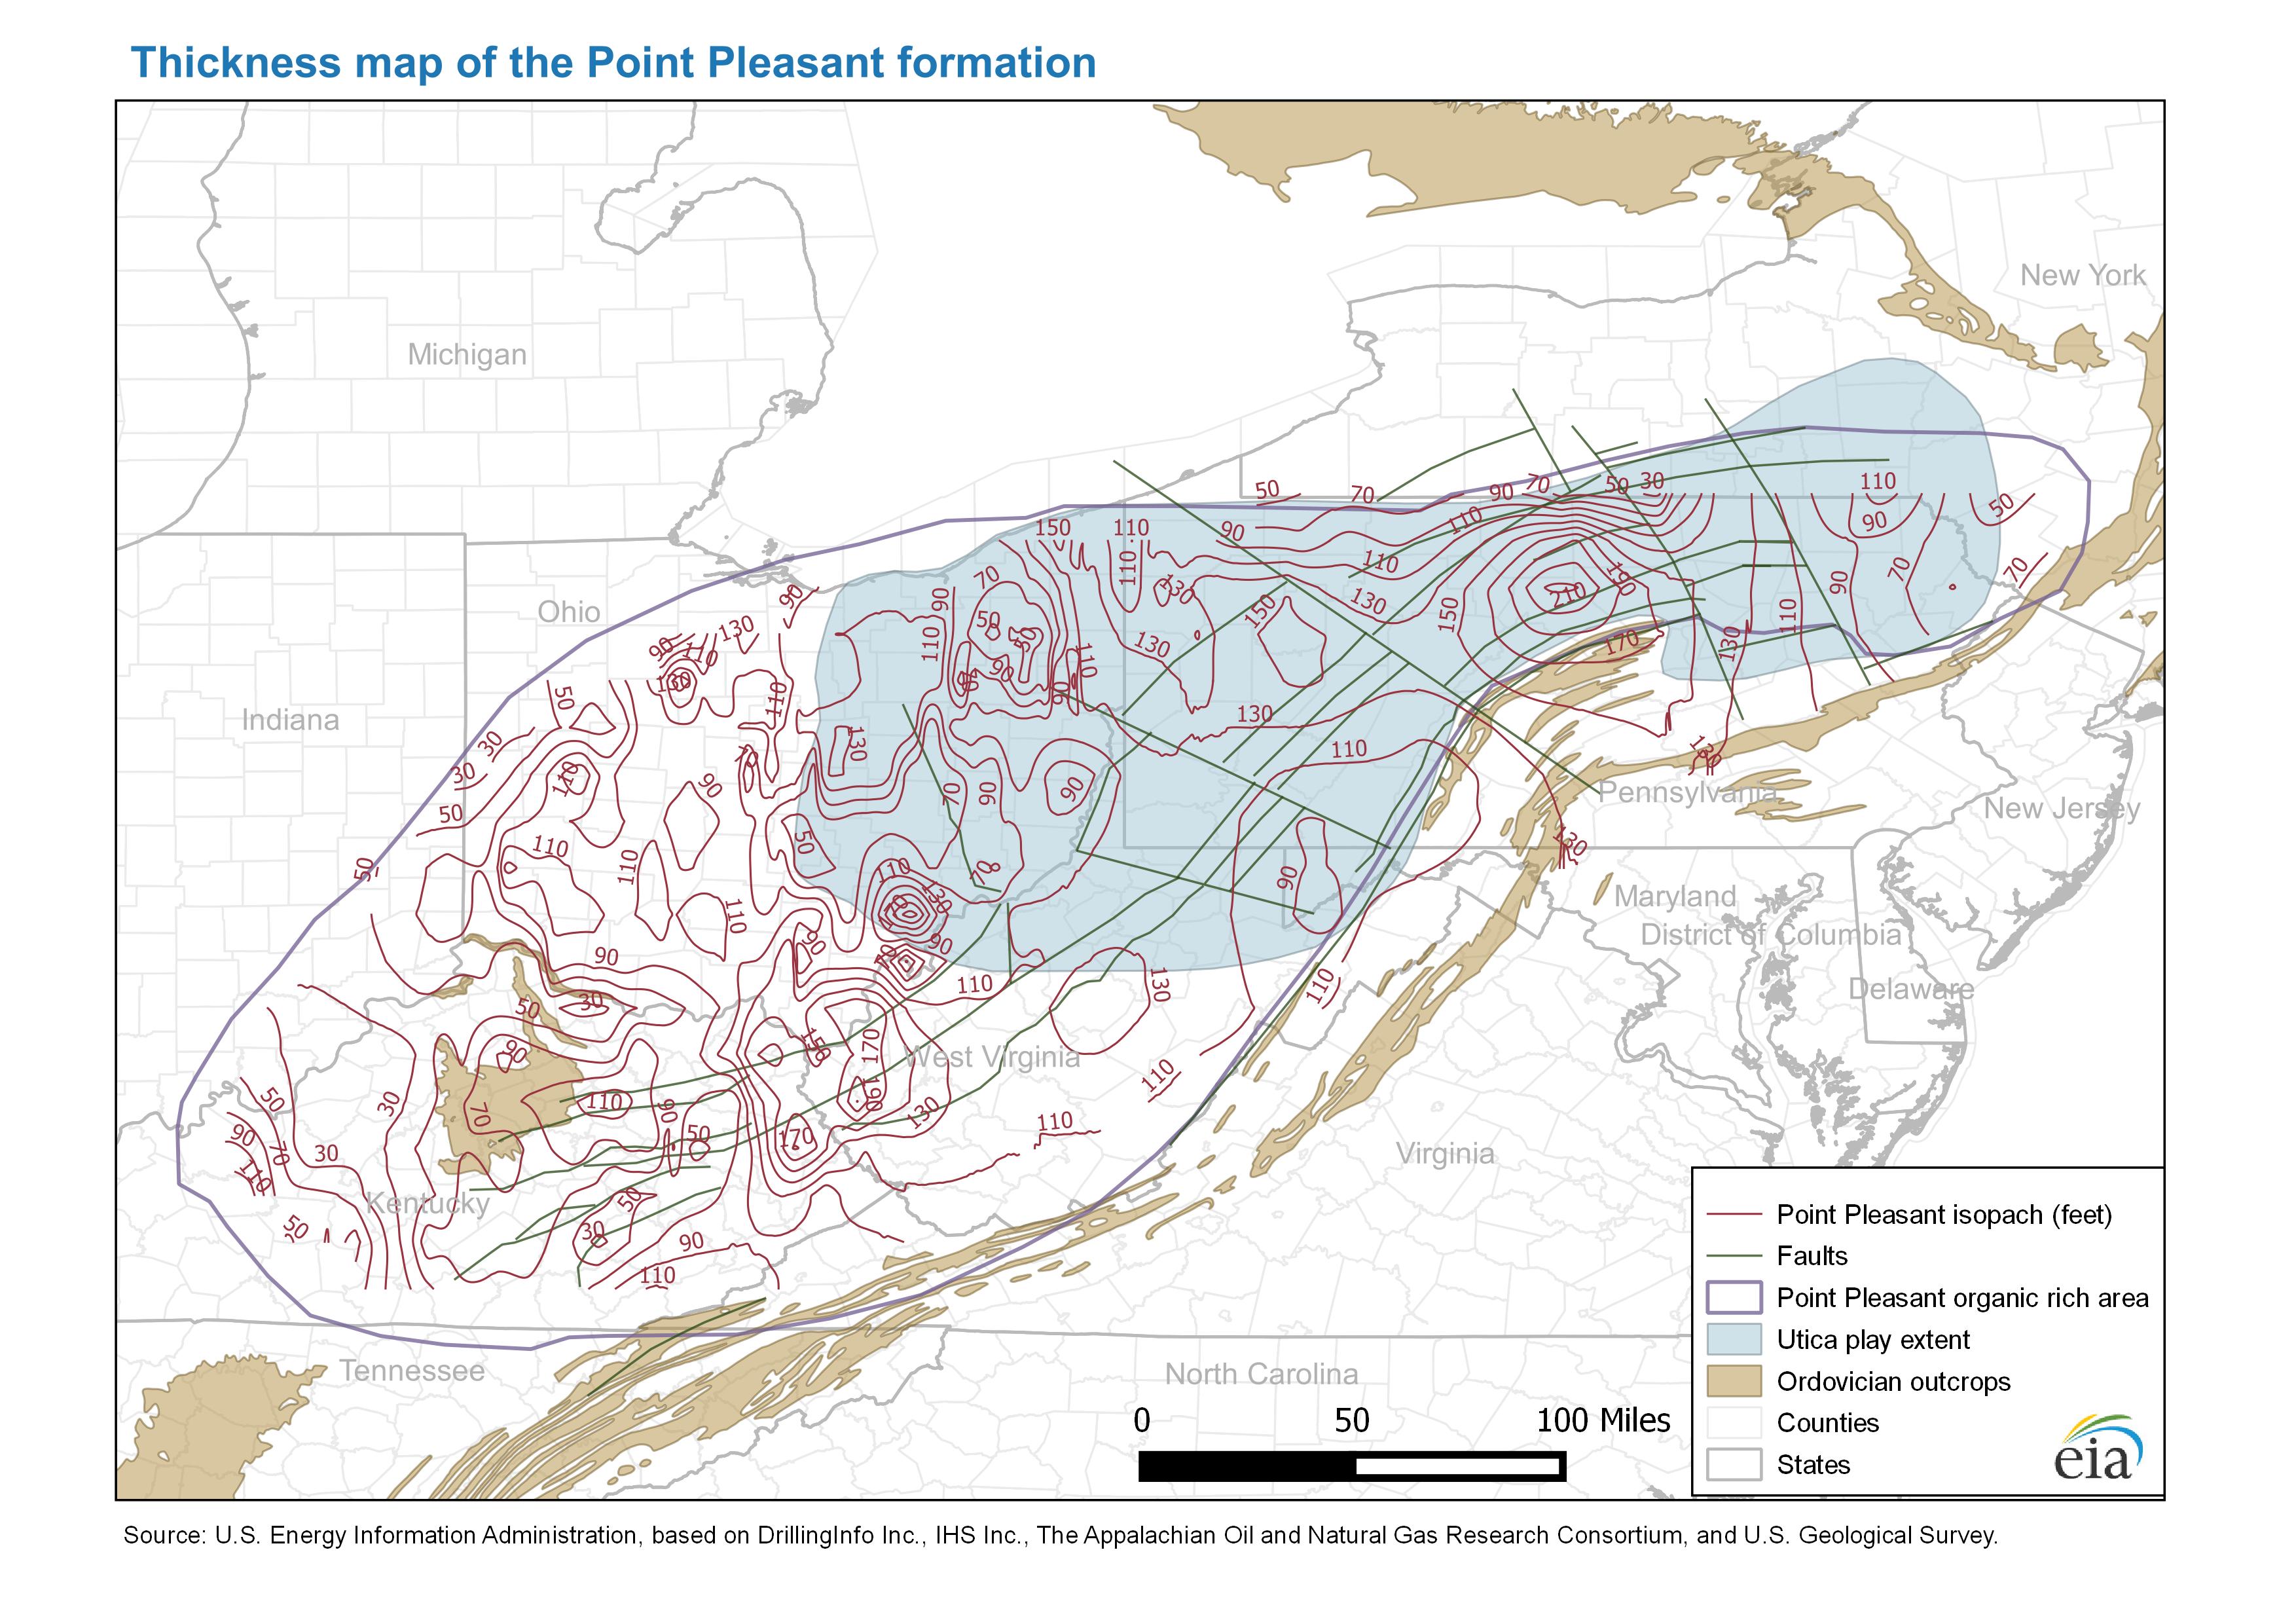
- Thickness map of the Point Pleasant formation (4/19/2016) PDF JPG
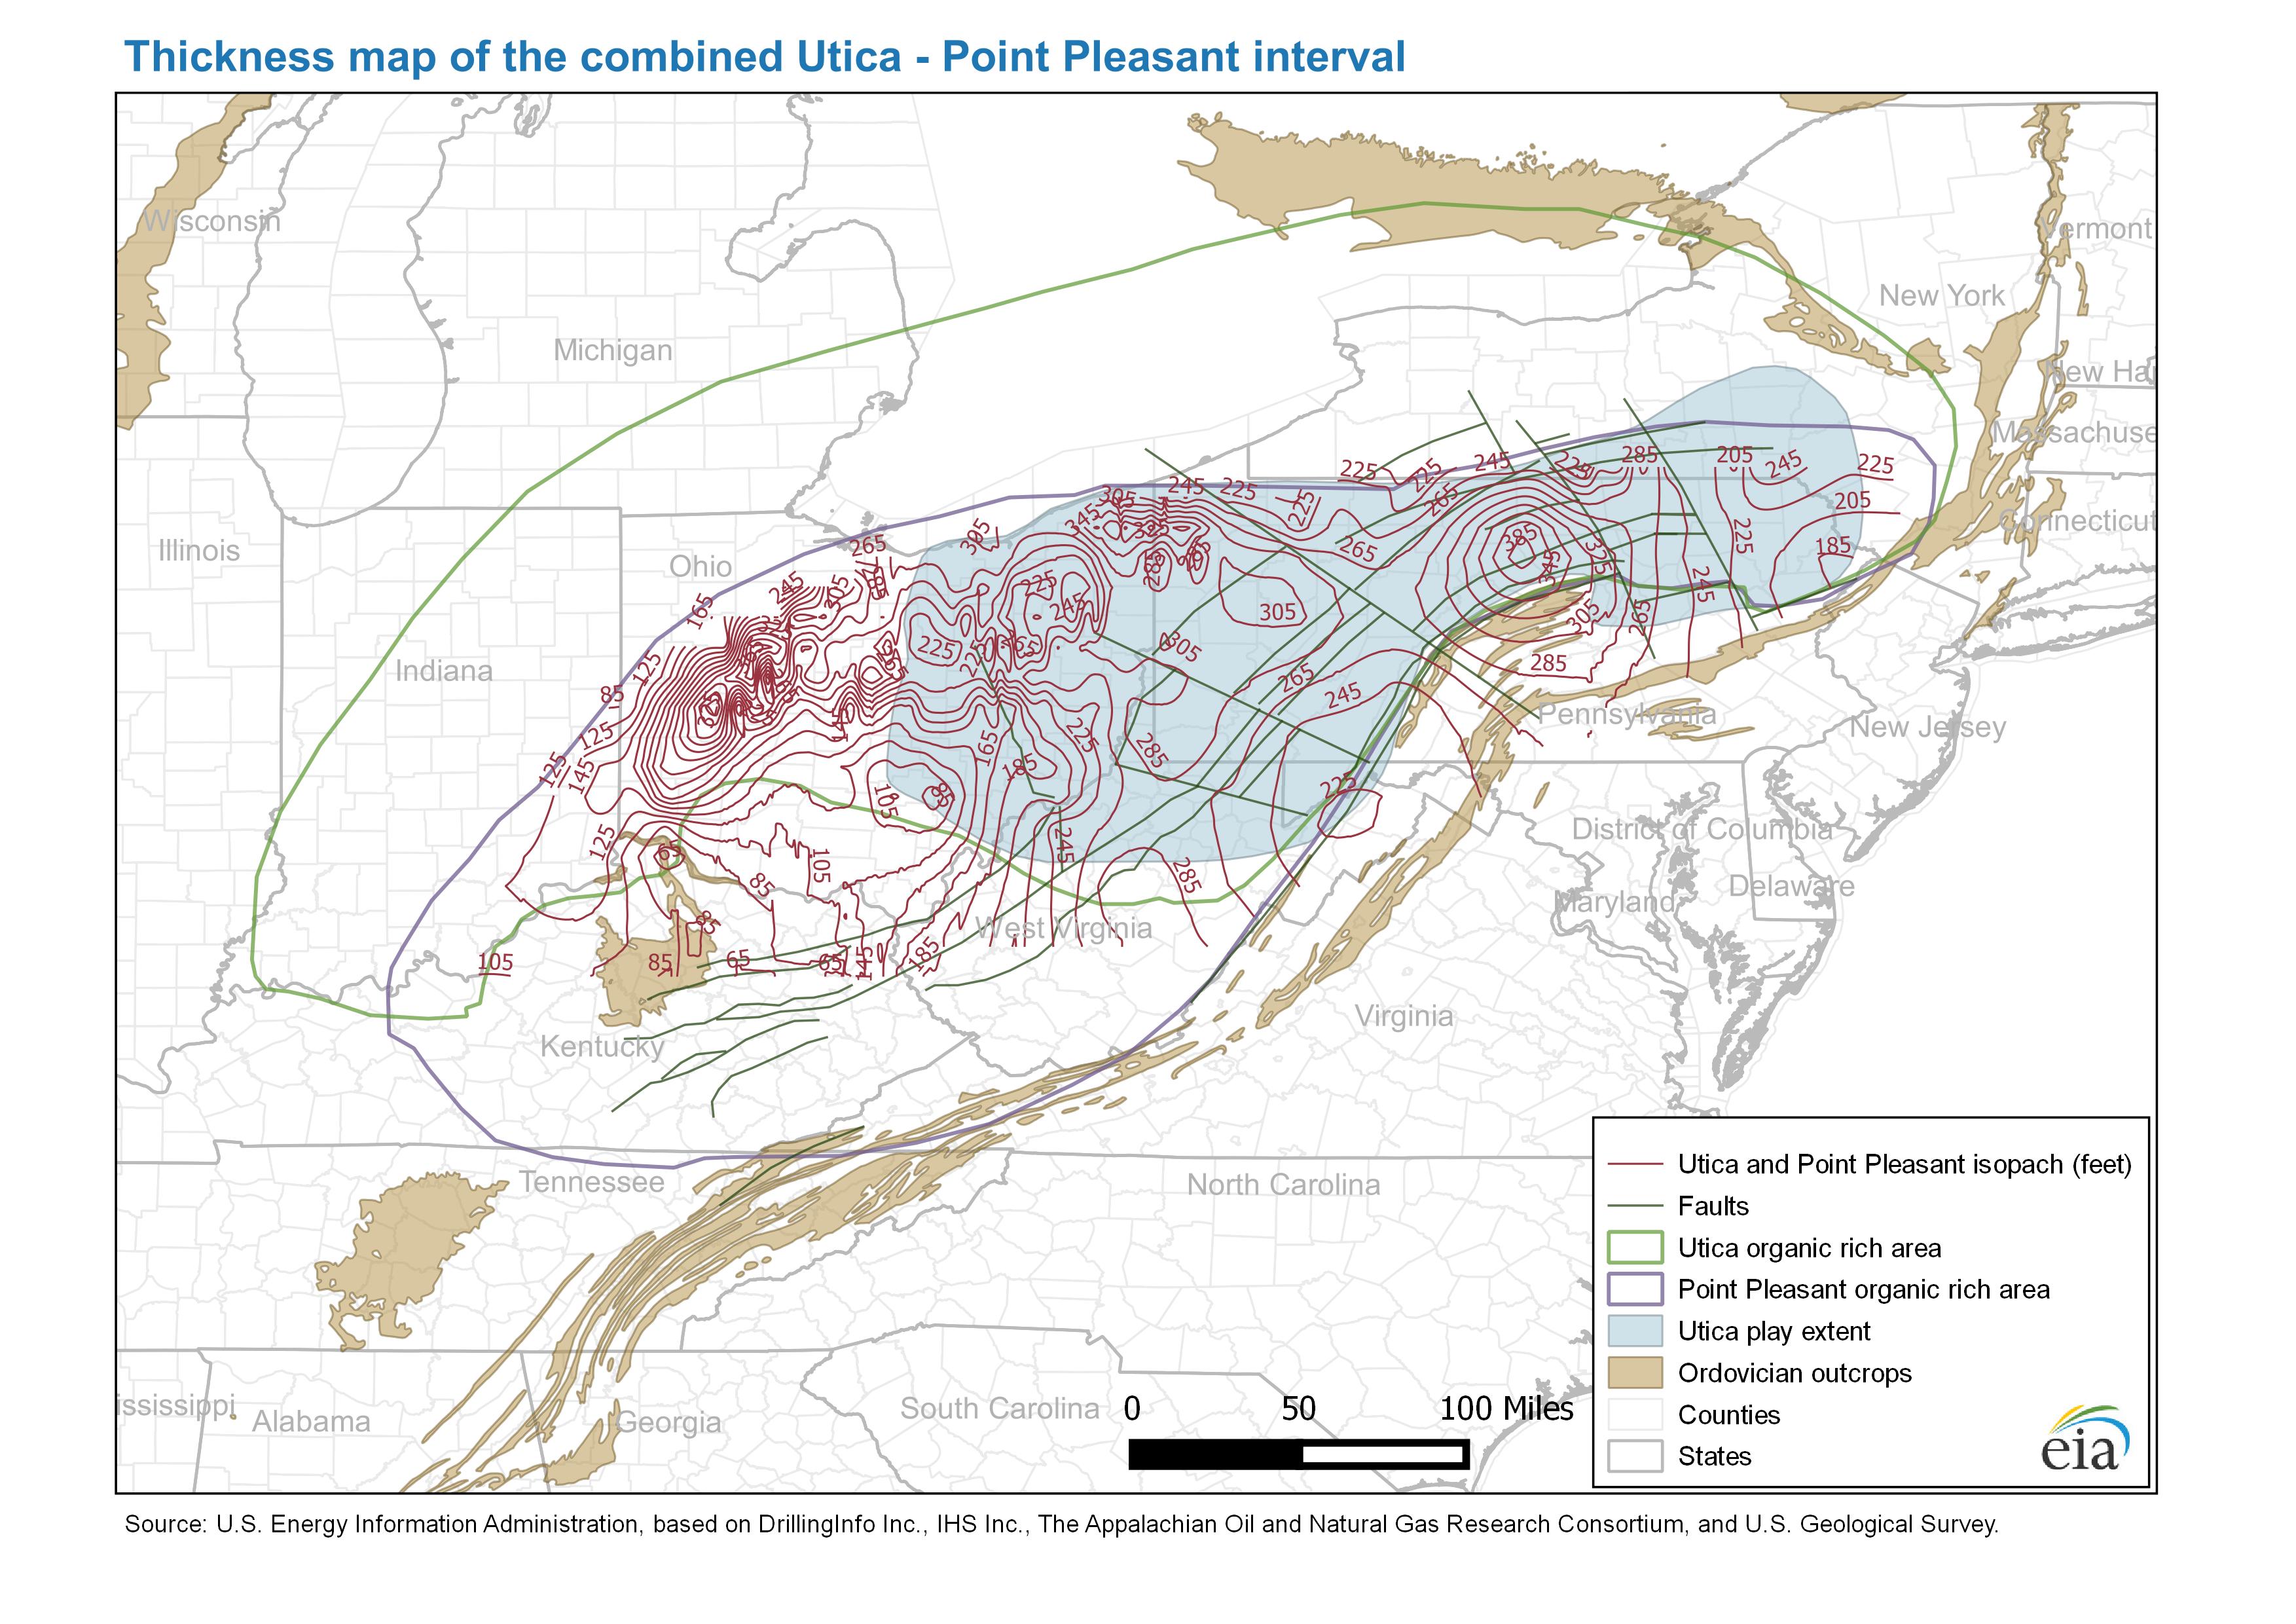
- Thickness map of the combined Utica - Point Pleasant interval (4/19/2016) PDF JPG
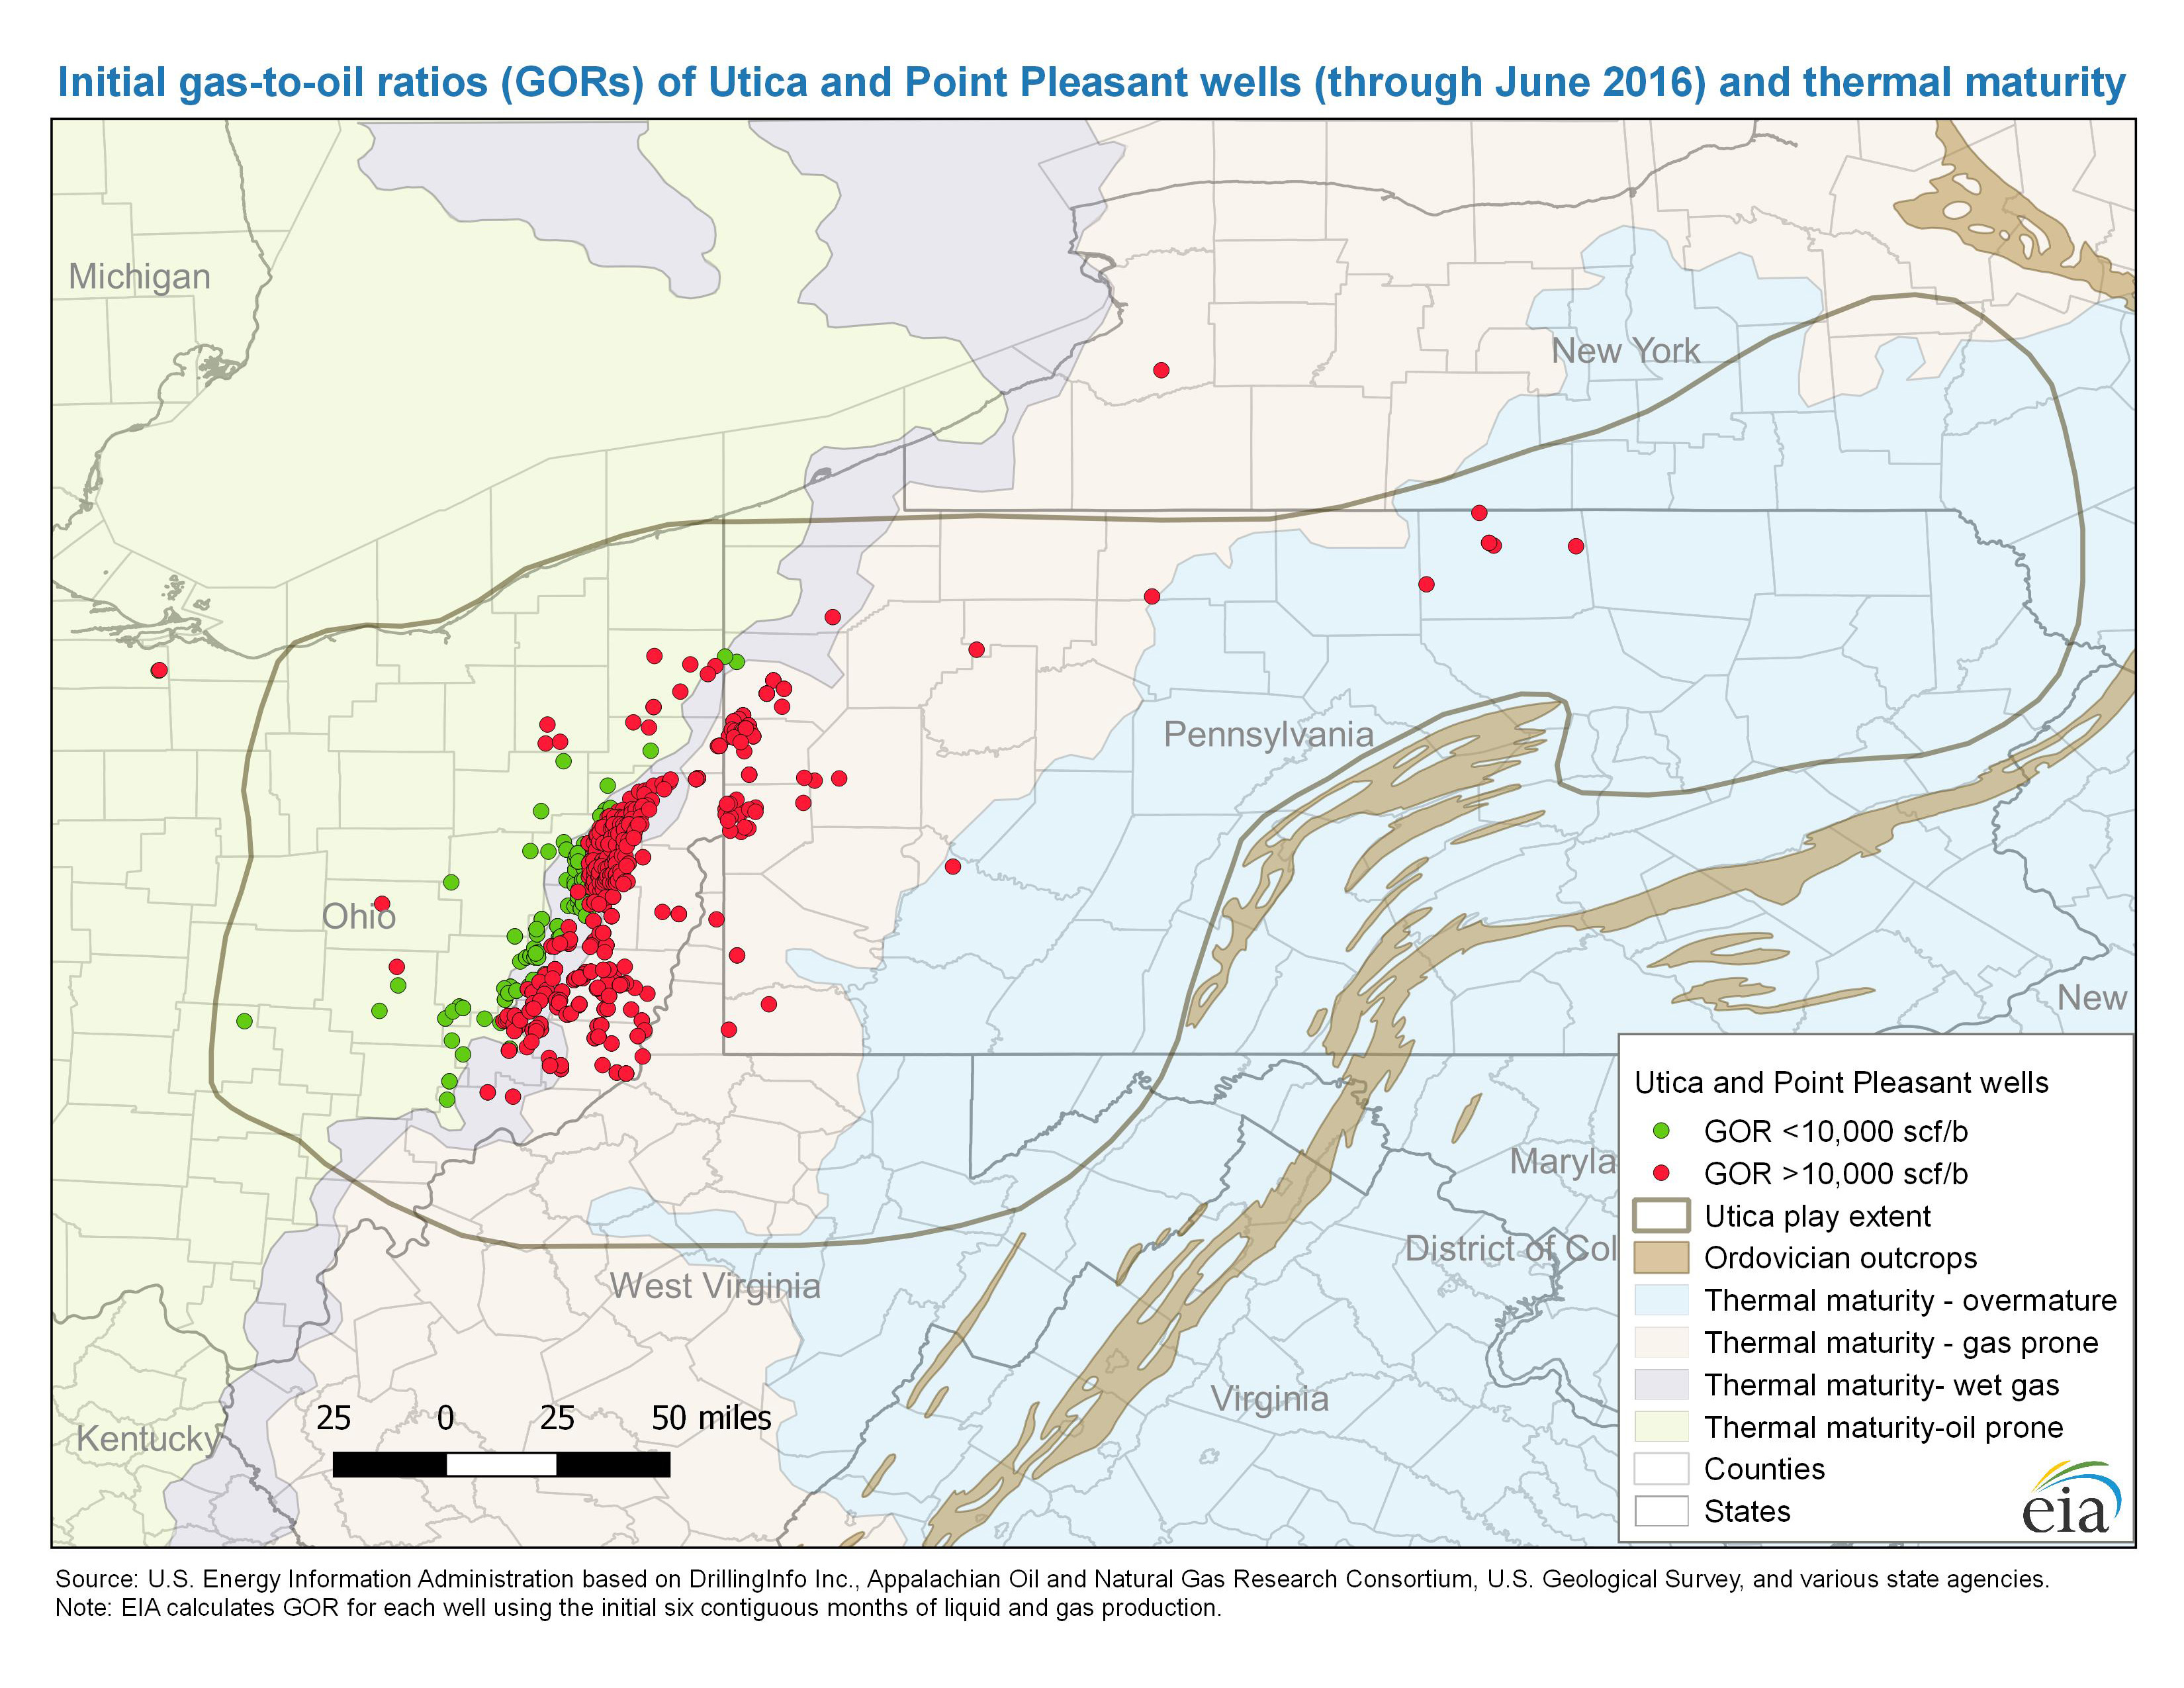
- Initial gas-to-oil ratios (GORs) of Utica and Point Pleasant wells through June 2016 and thermal maturity (9/21/2016) PDF JPG
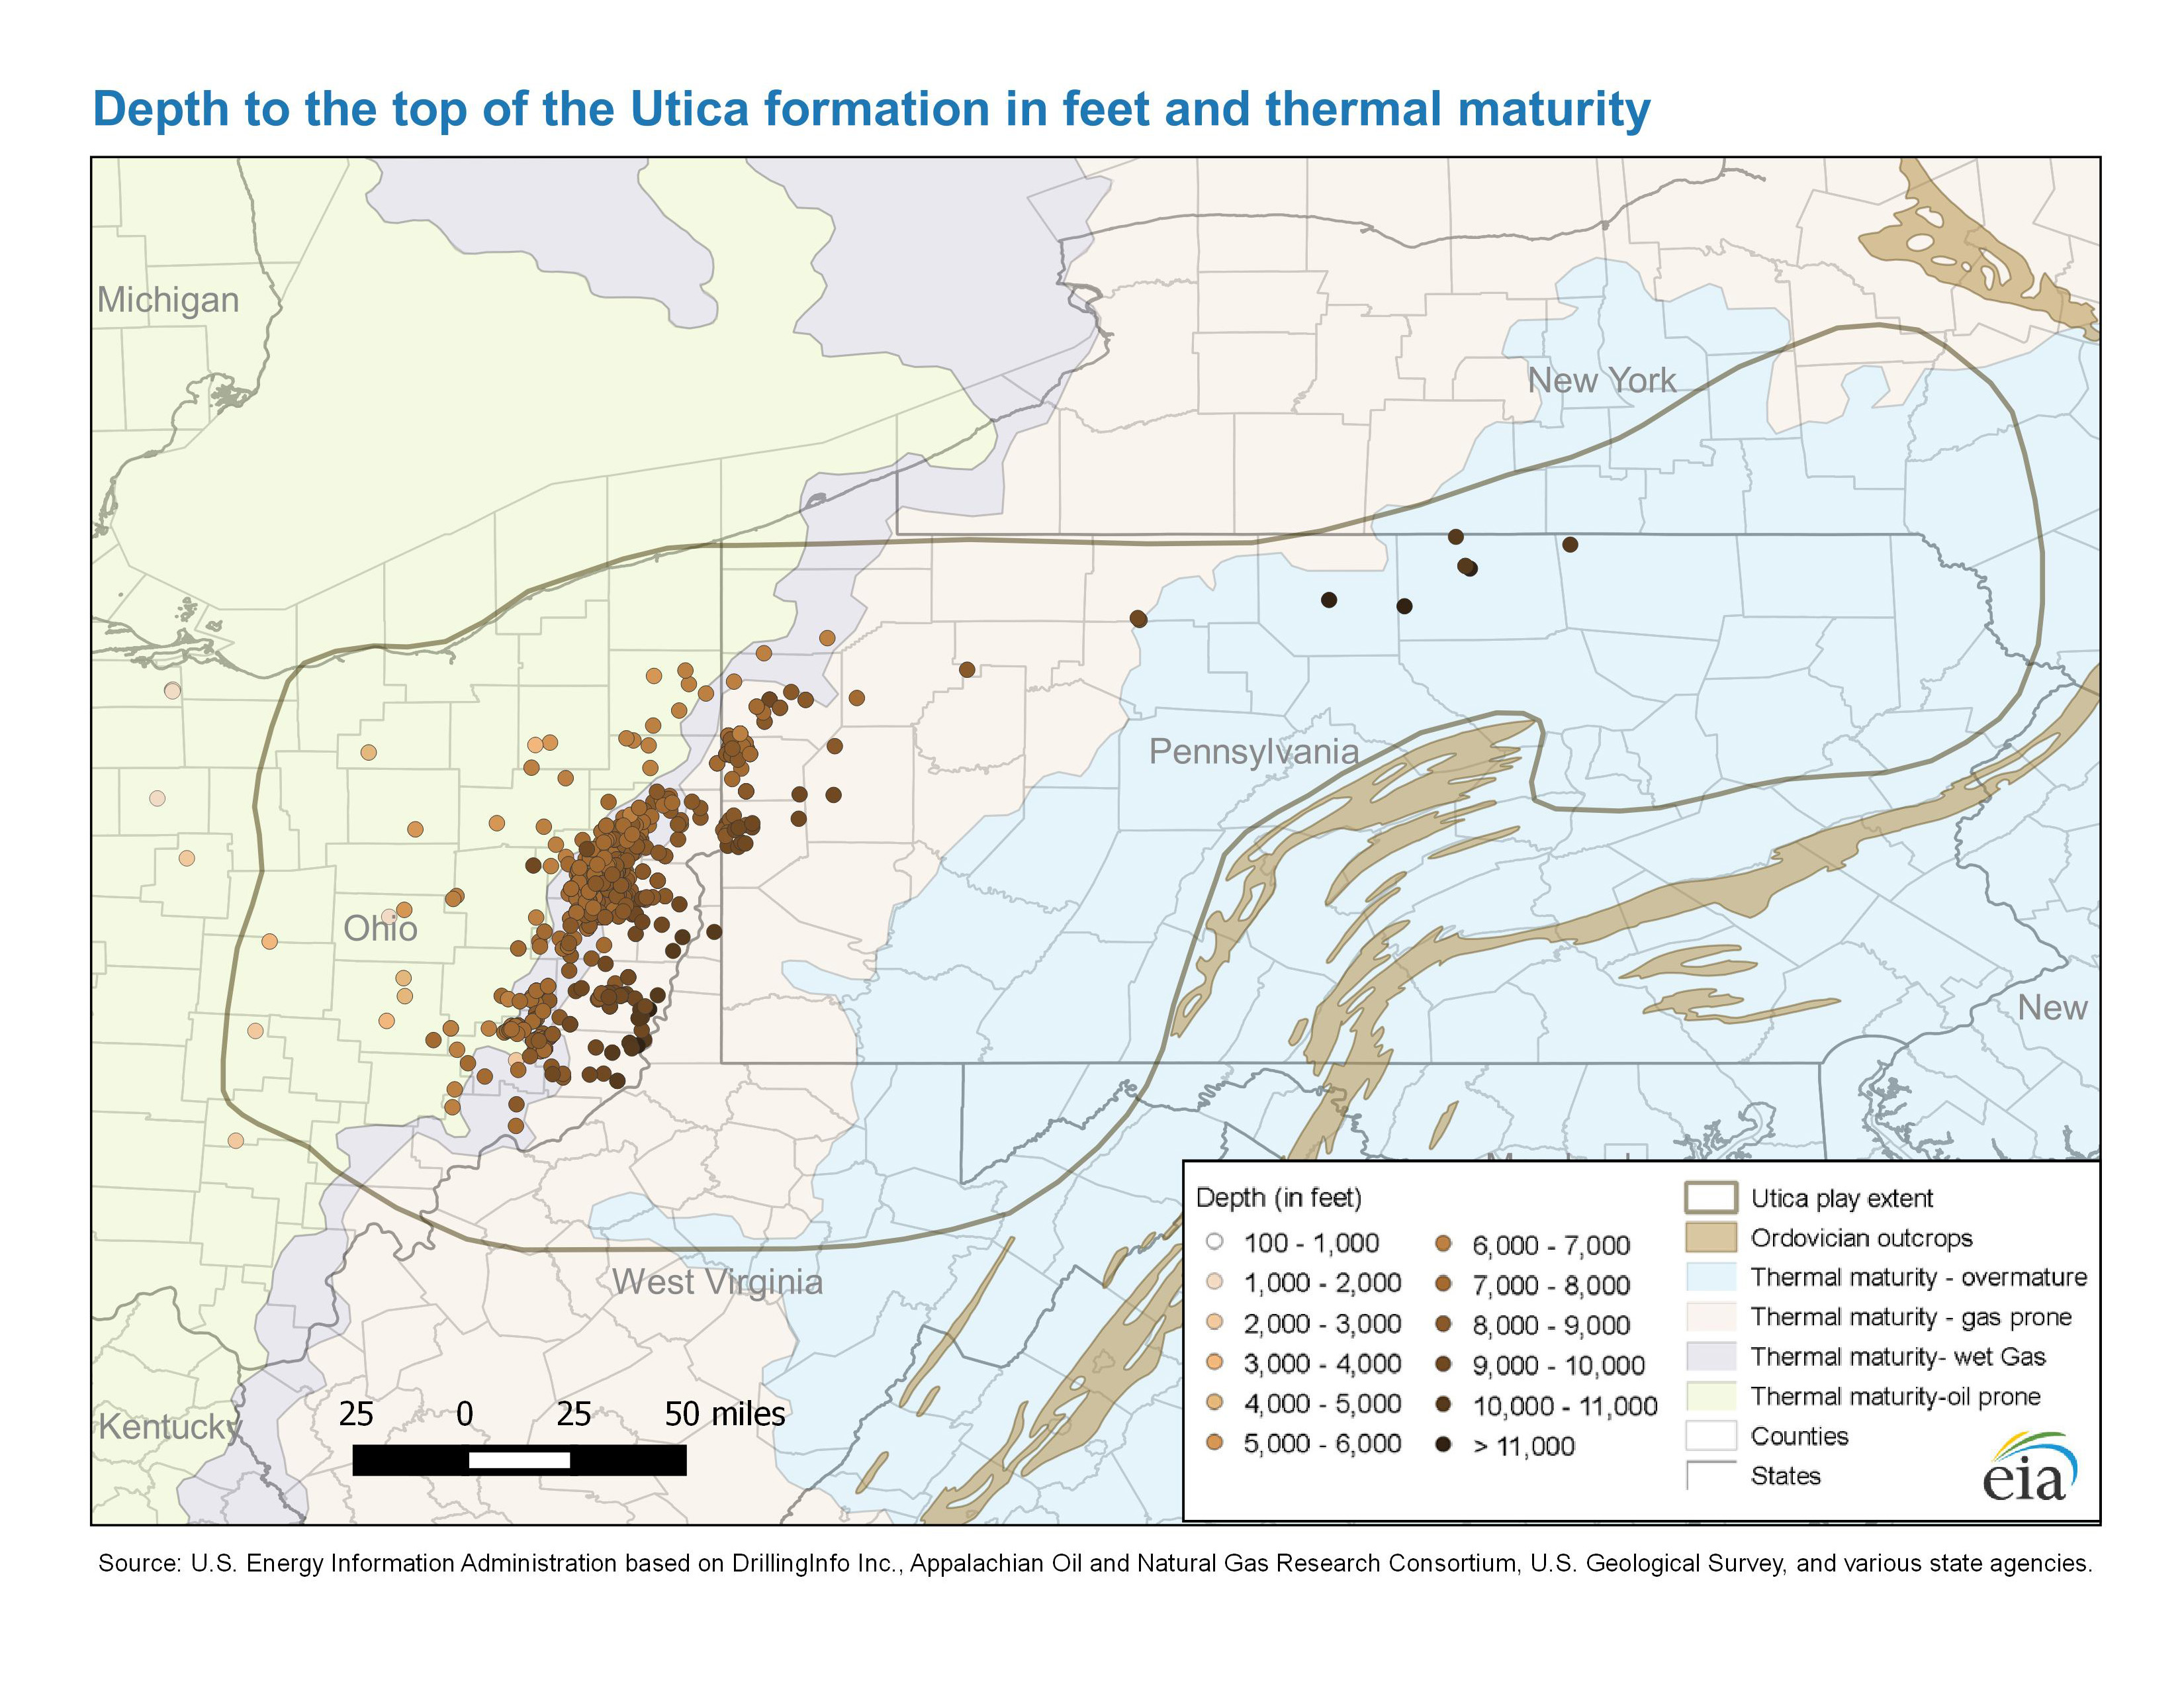
- Depth to the top of the Utica formation in feet and thermal maturity (9/21/2016) PDF JPG
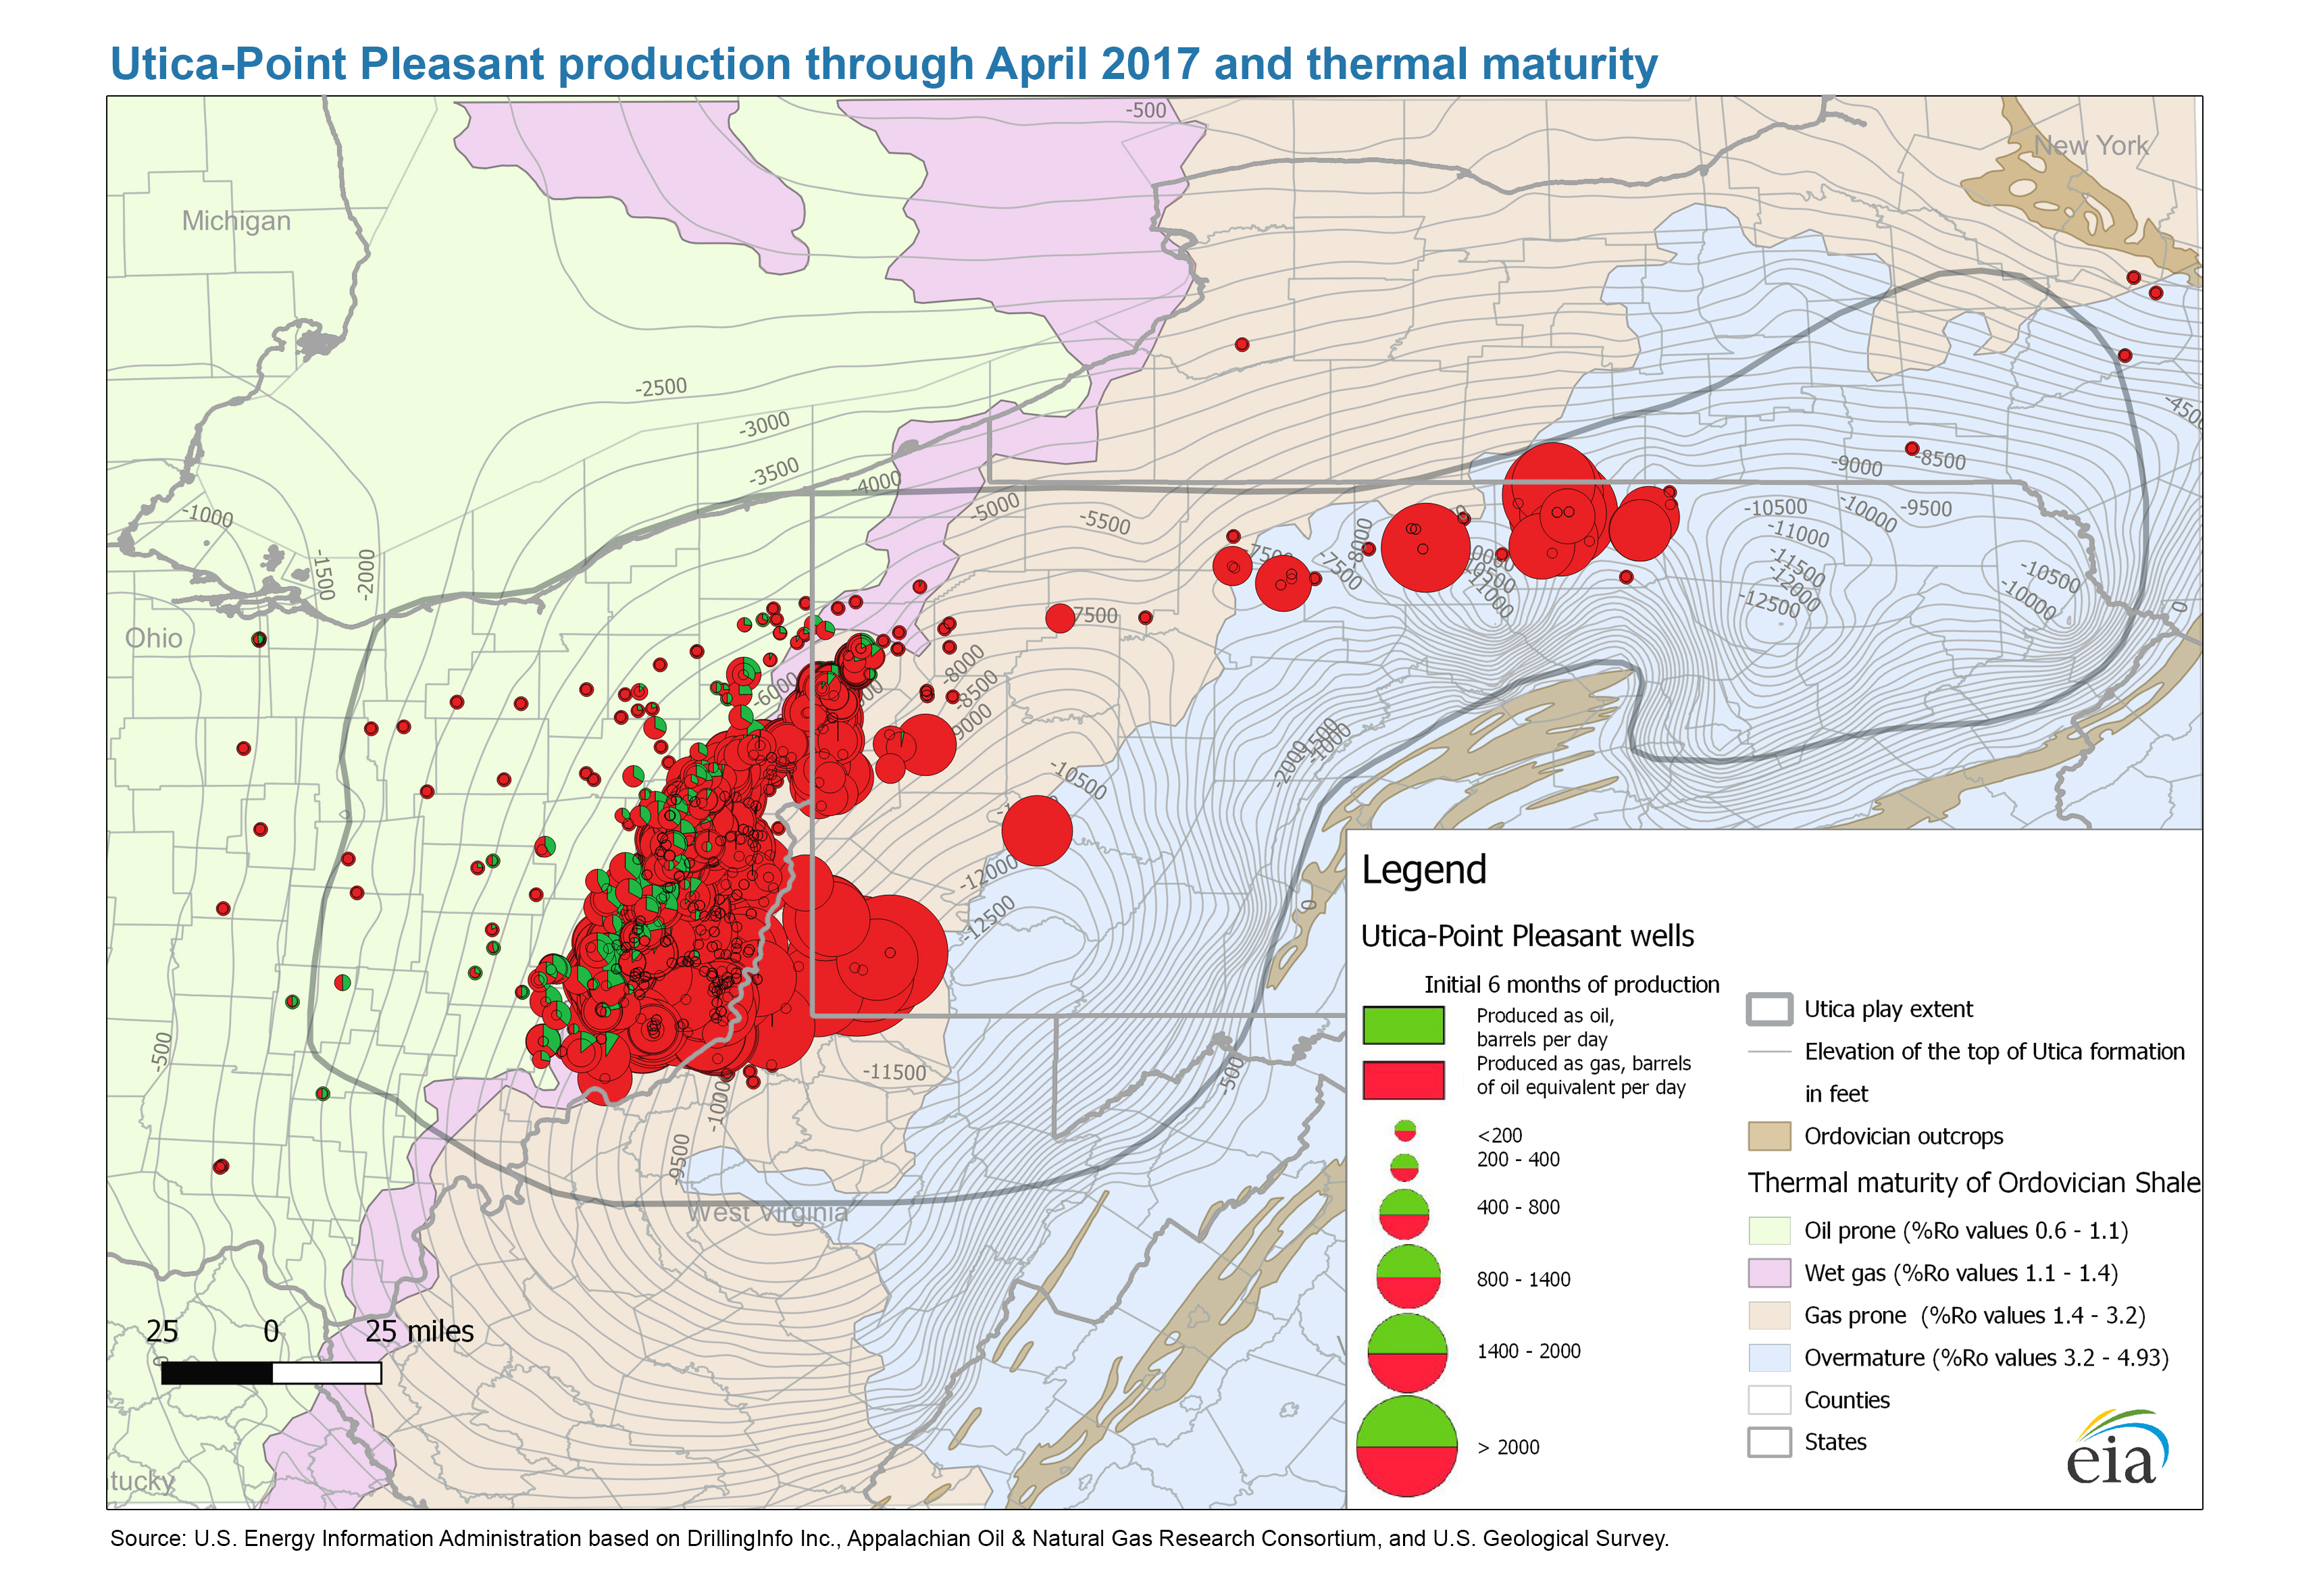
- Utica and Point Pleasant production through April 2017 and thermal maturity (4/20/2017) PDF JPG
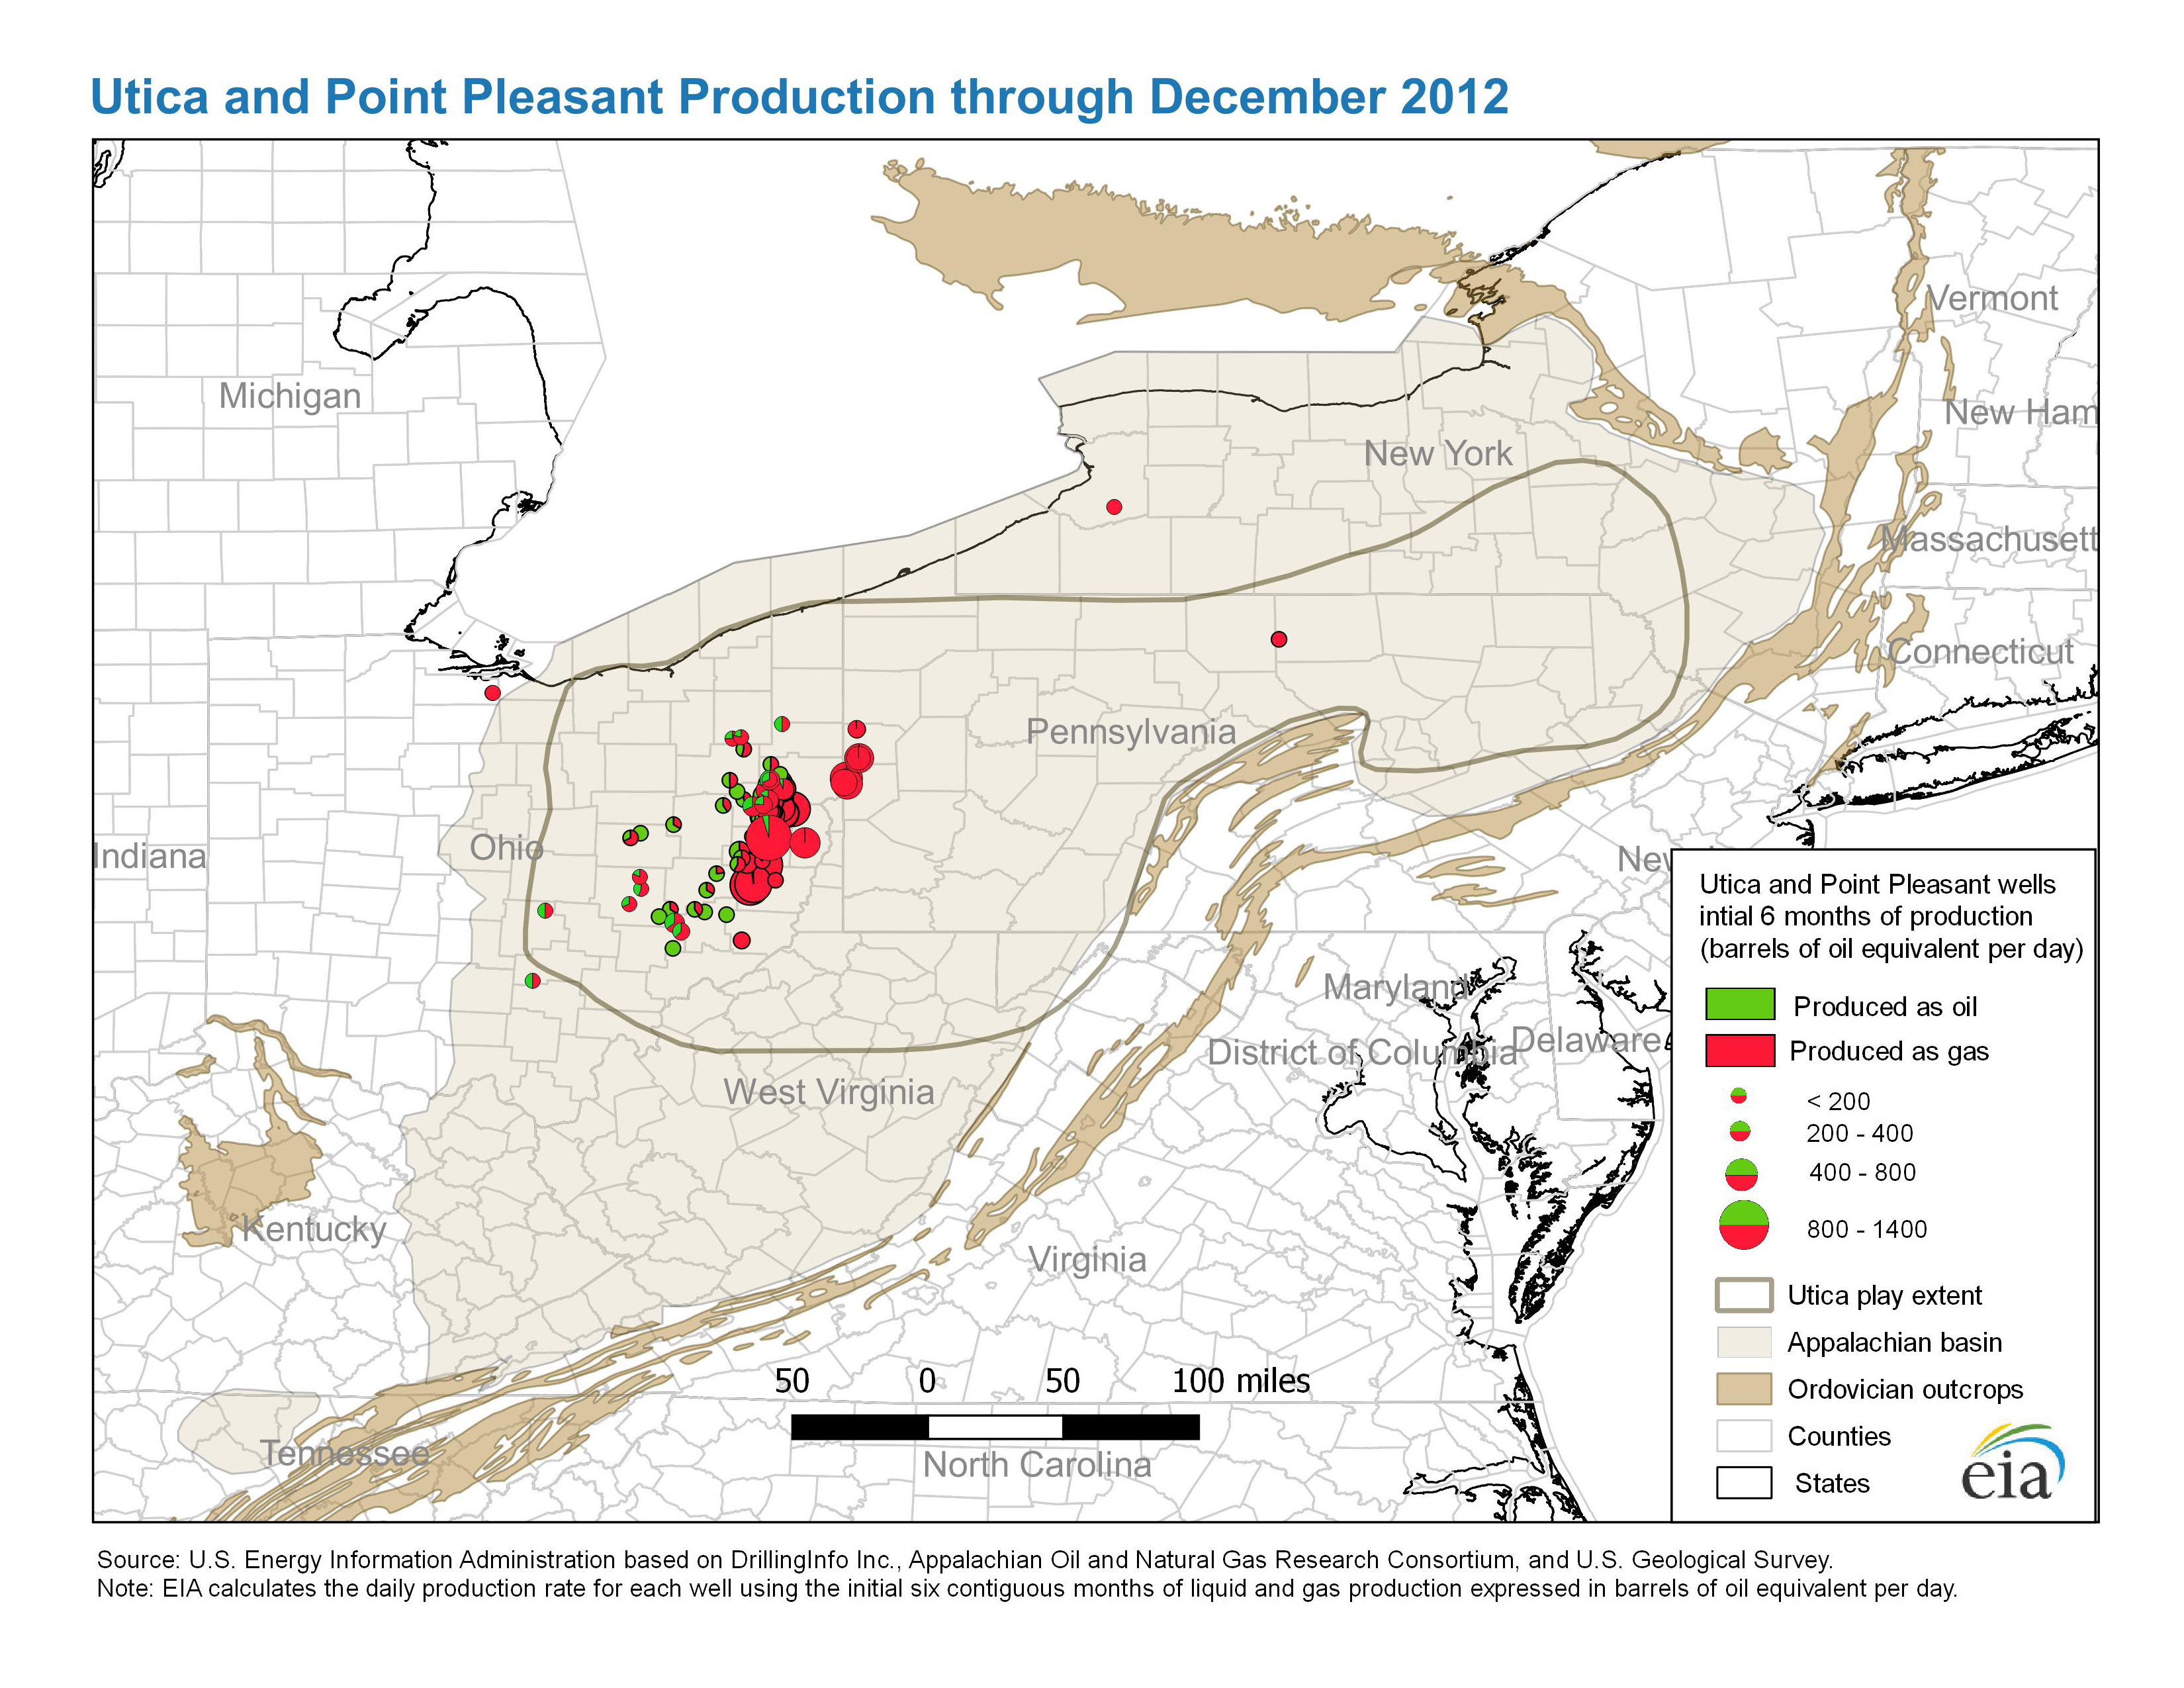
- Utica and Point Pleasant production through December 2012 (9/21/2016) PDF JPG
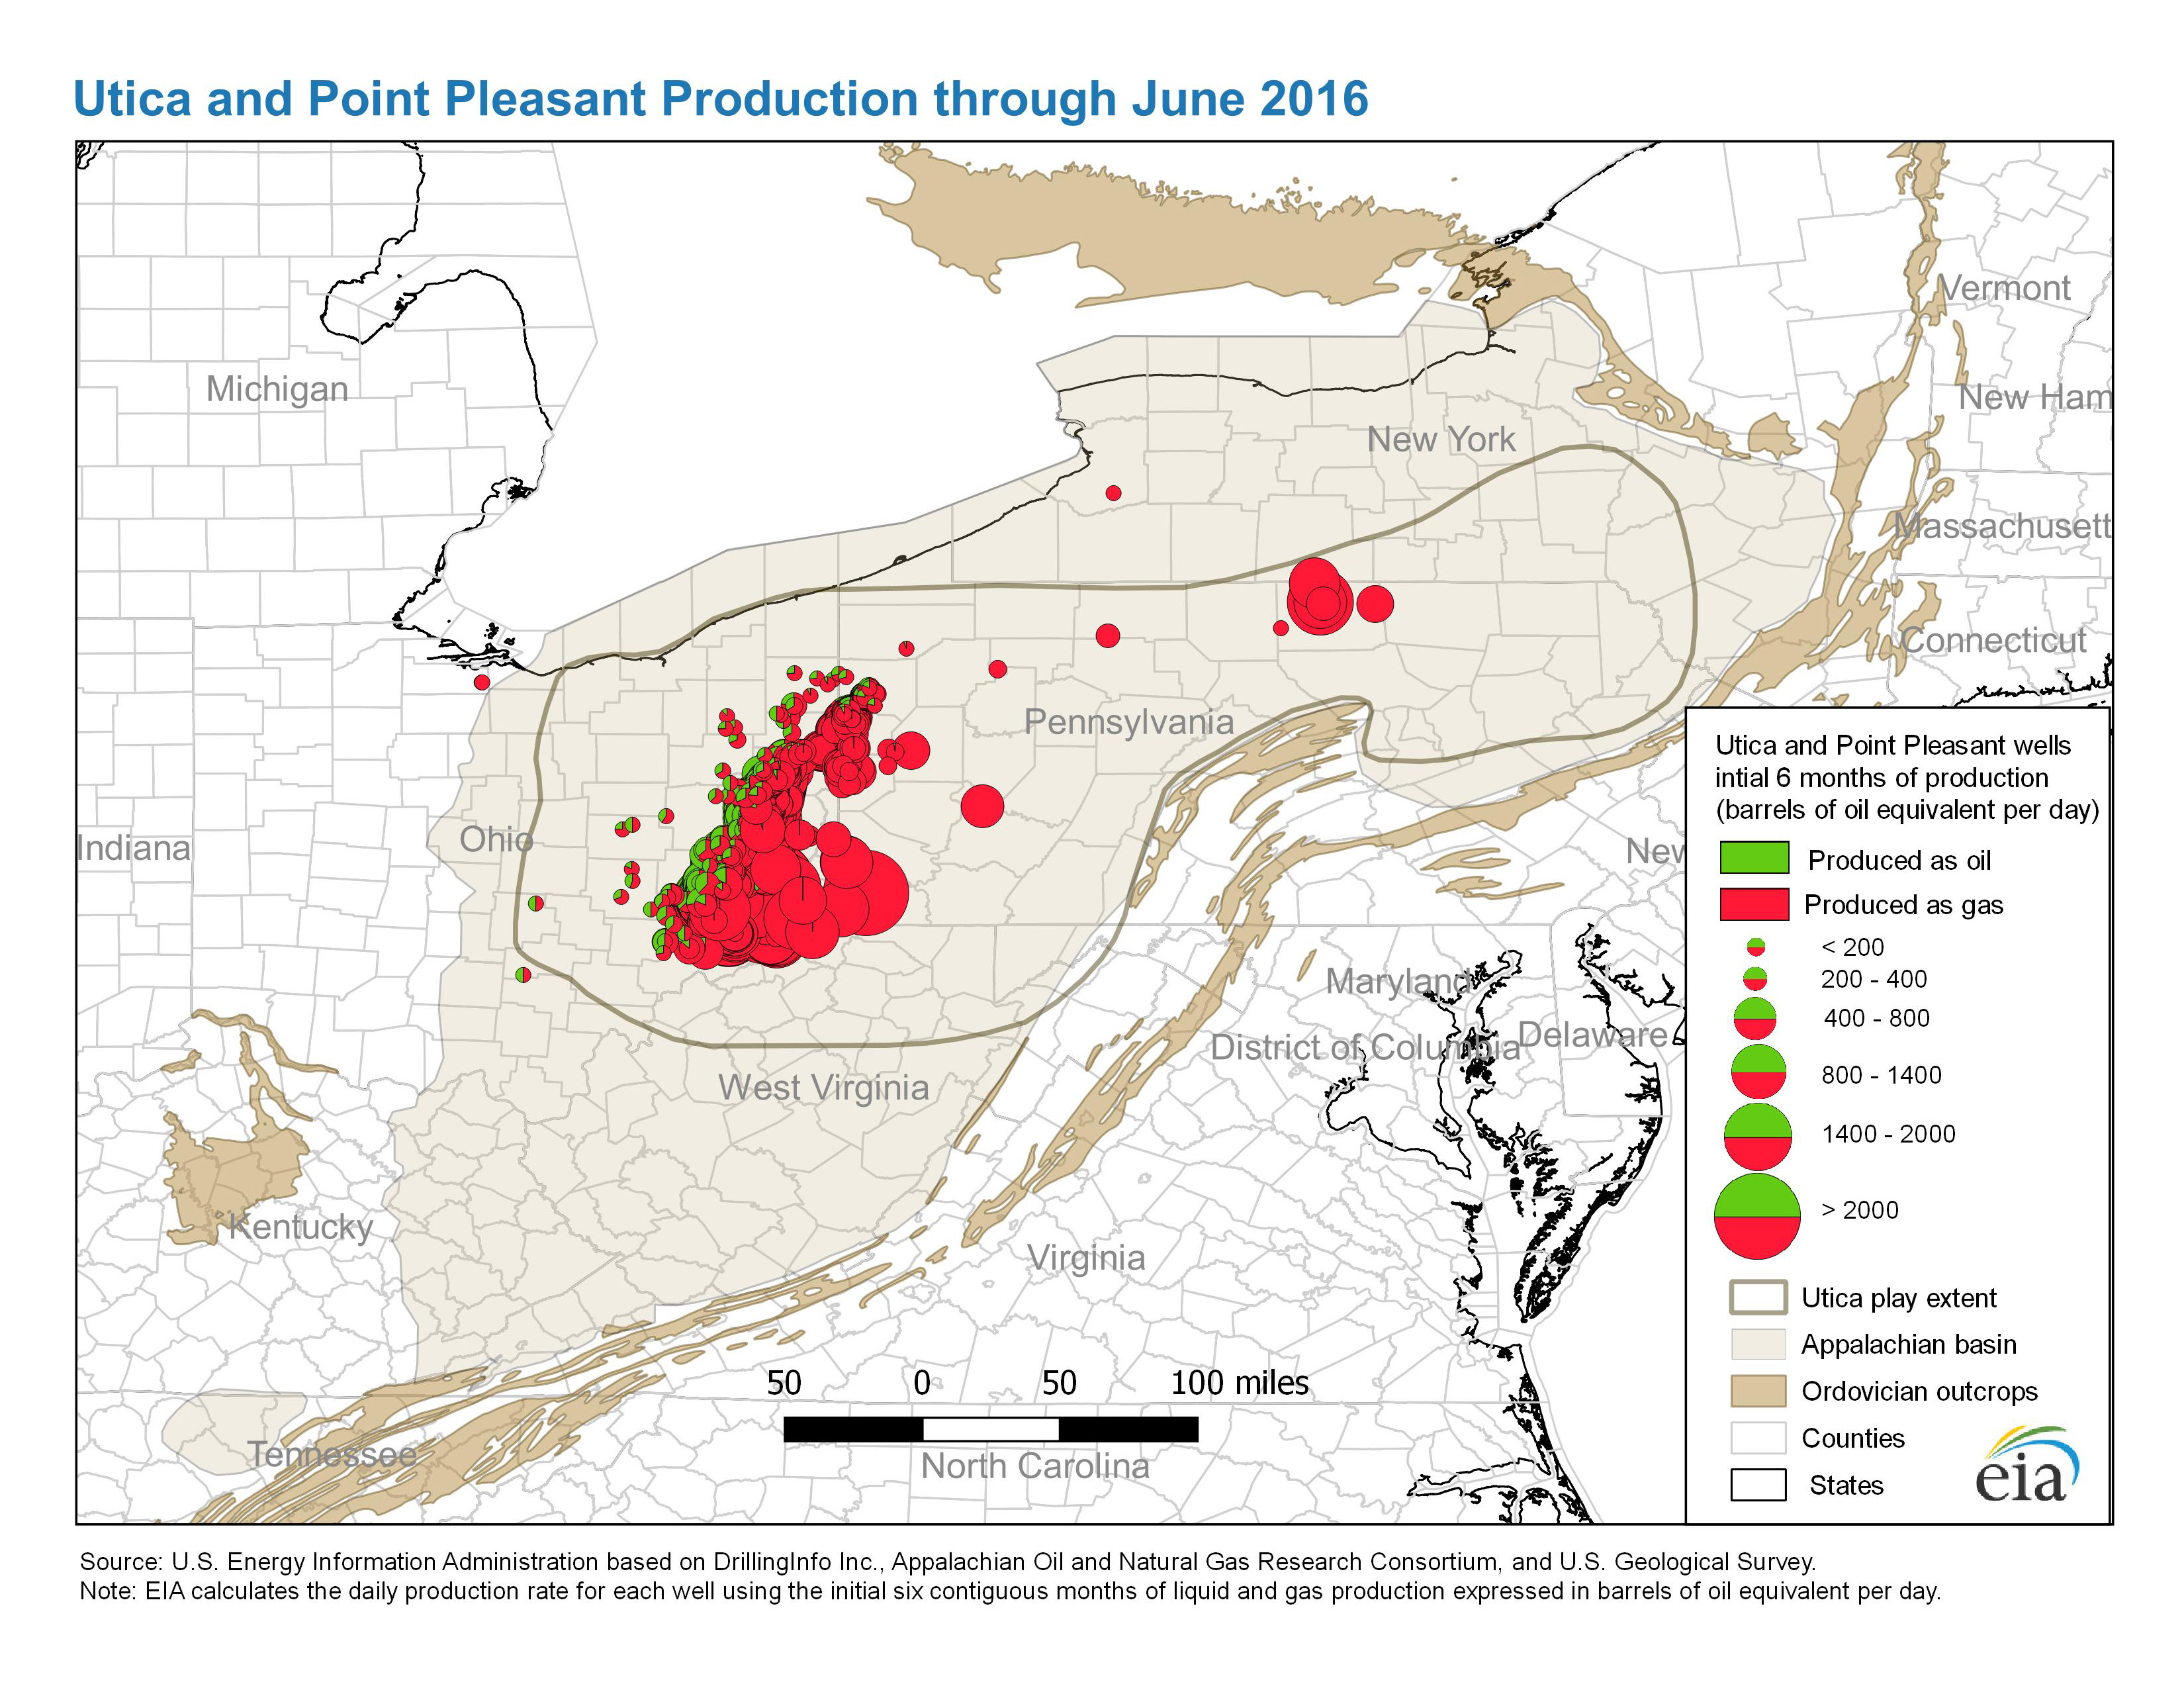
- Utica and Point Pleasant production through June 2016 (9/21/2016) PDF JPG
Map data
- Marcellus play boundaries, structure and isopachs (3/11/2016) Shapefile
- Utica play: play boundaries, structure and Isopach for Utica and Point Pleasant formations (5/6/2016) Shapefile
- Utica play: Major structural and tectonic features (5/9/2016) Shapefile
|
Ft. Worth Basin, Texas
- Barnett Shale (6/1/2011) PDF PDF(letter-size)
- History animation: Barnett Shale Drilling, 1981-2010 (6/1/2011) ZIP
|
Permian Basin
- Permian Basin: Part I: Wolfcamp, Bone Spring, Delaware Shale Plays of the Delaware Basin (2/13/2020) PDF
- Permian Basin: Part II: Wolfcamp Shale Play of the Midland Basin (9/9/2020) PDF
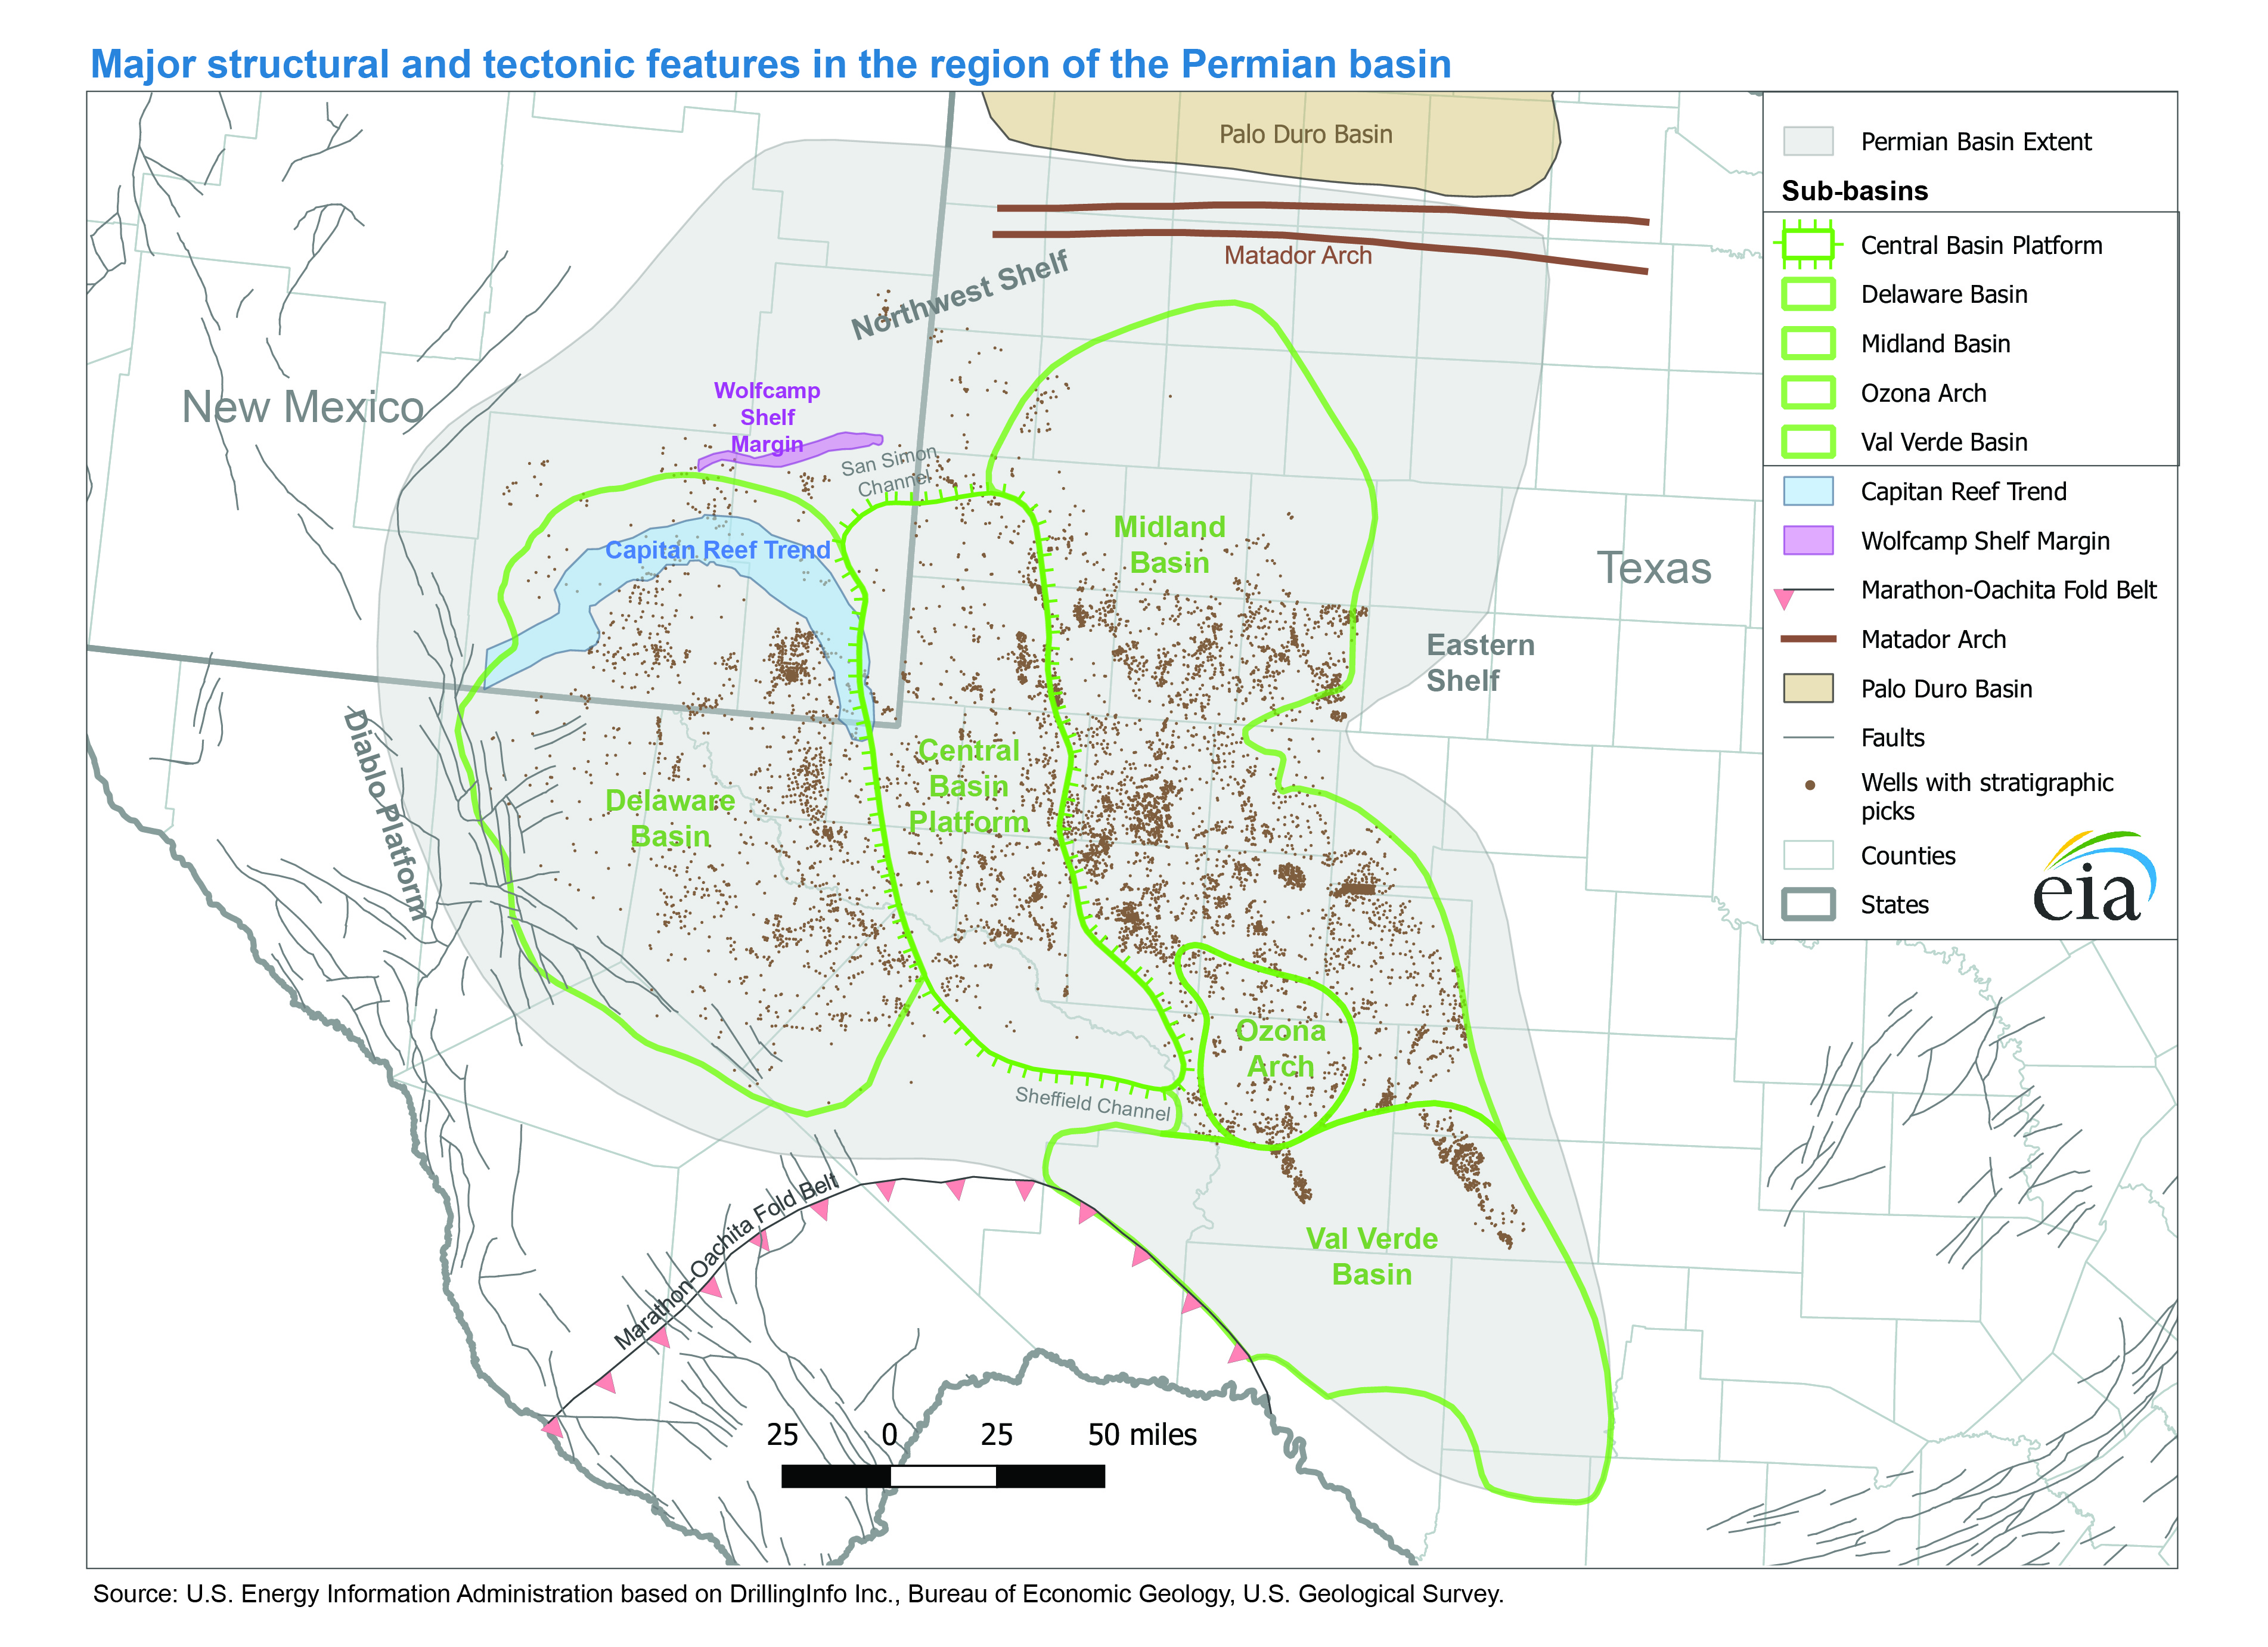
- Major structural and tectonic features of the Permian Basin (12/21/2017) PDF JPG
Map data
- Abo-Yeso, Glorieta-Yeso, and Spraberry play boundaries (3/11/2016) Shapefile
- Permian Basin: boundary, structure and tectonic features (12/21/2017) Shapefile
Delaware formation
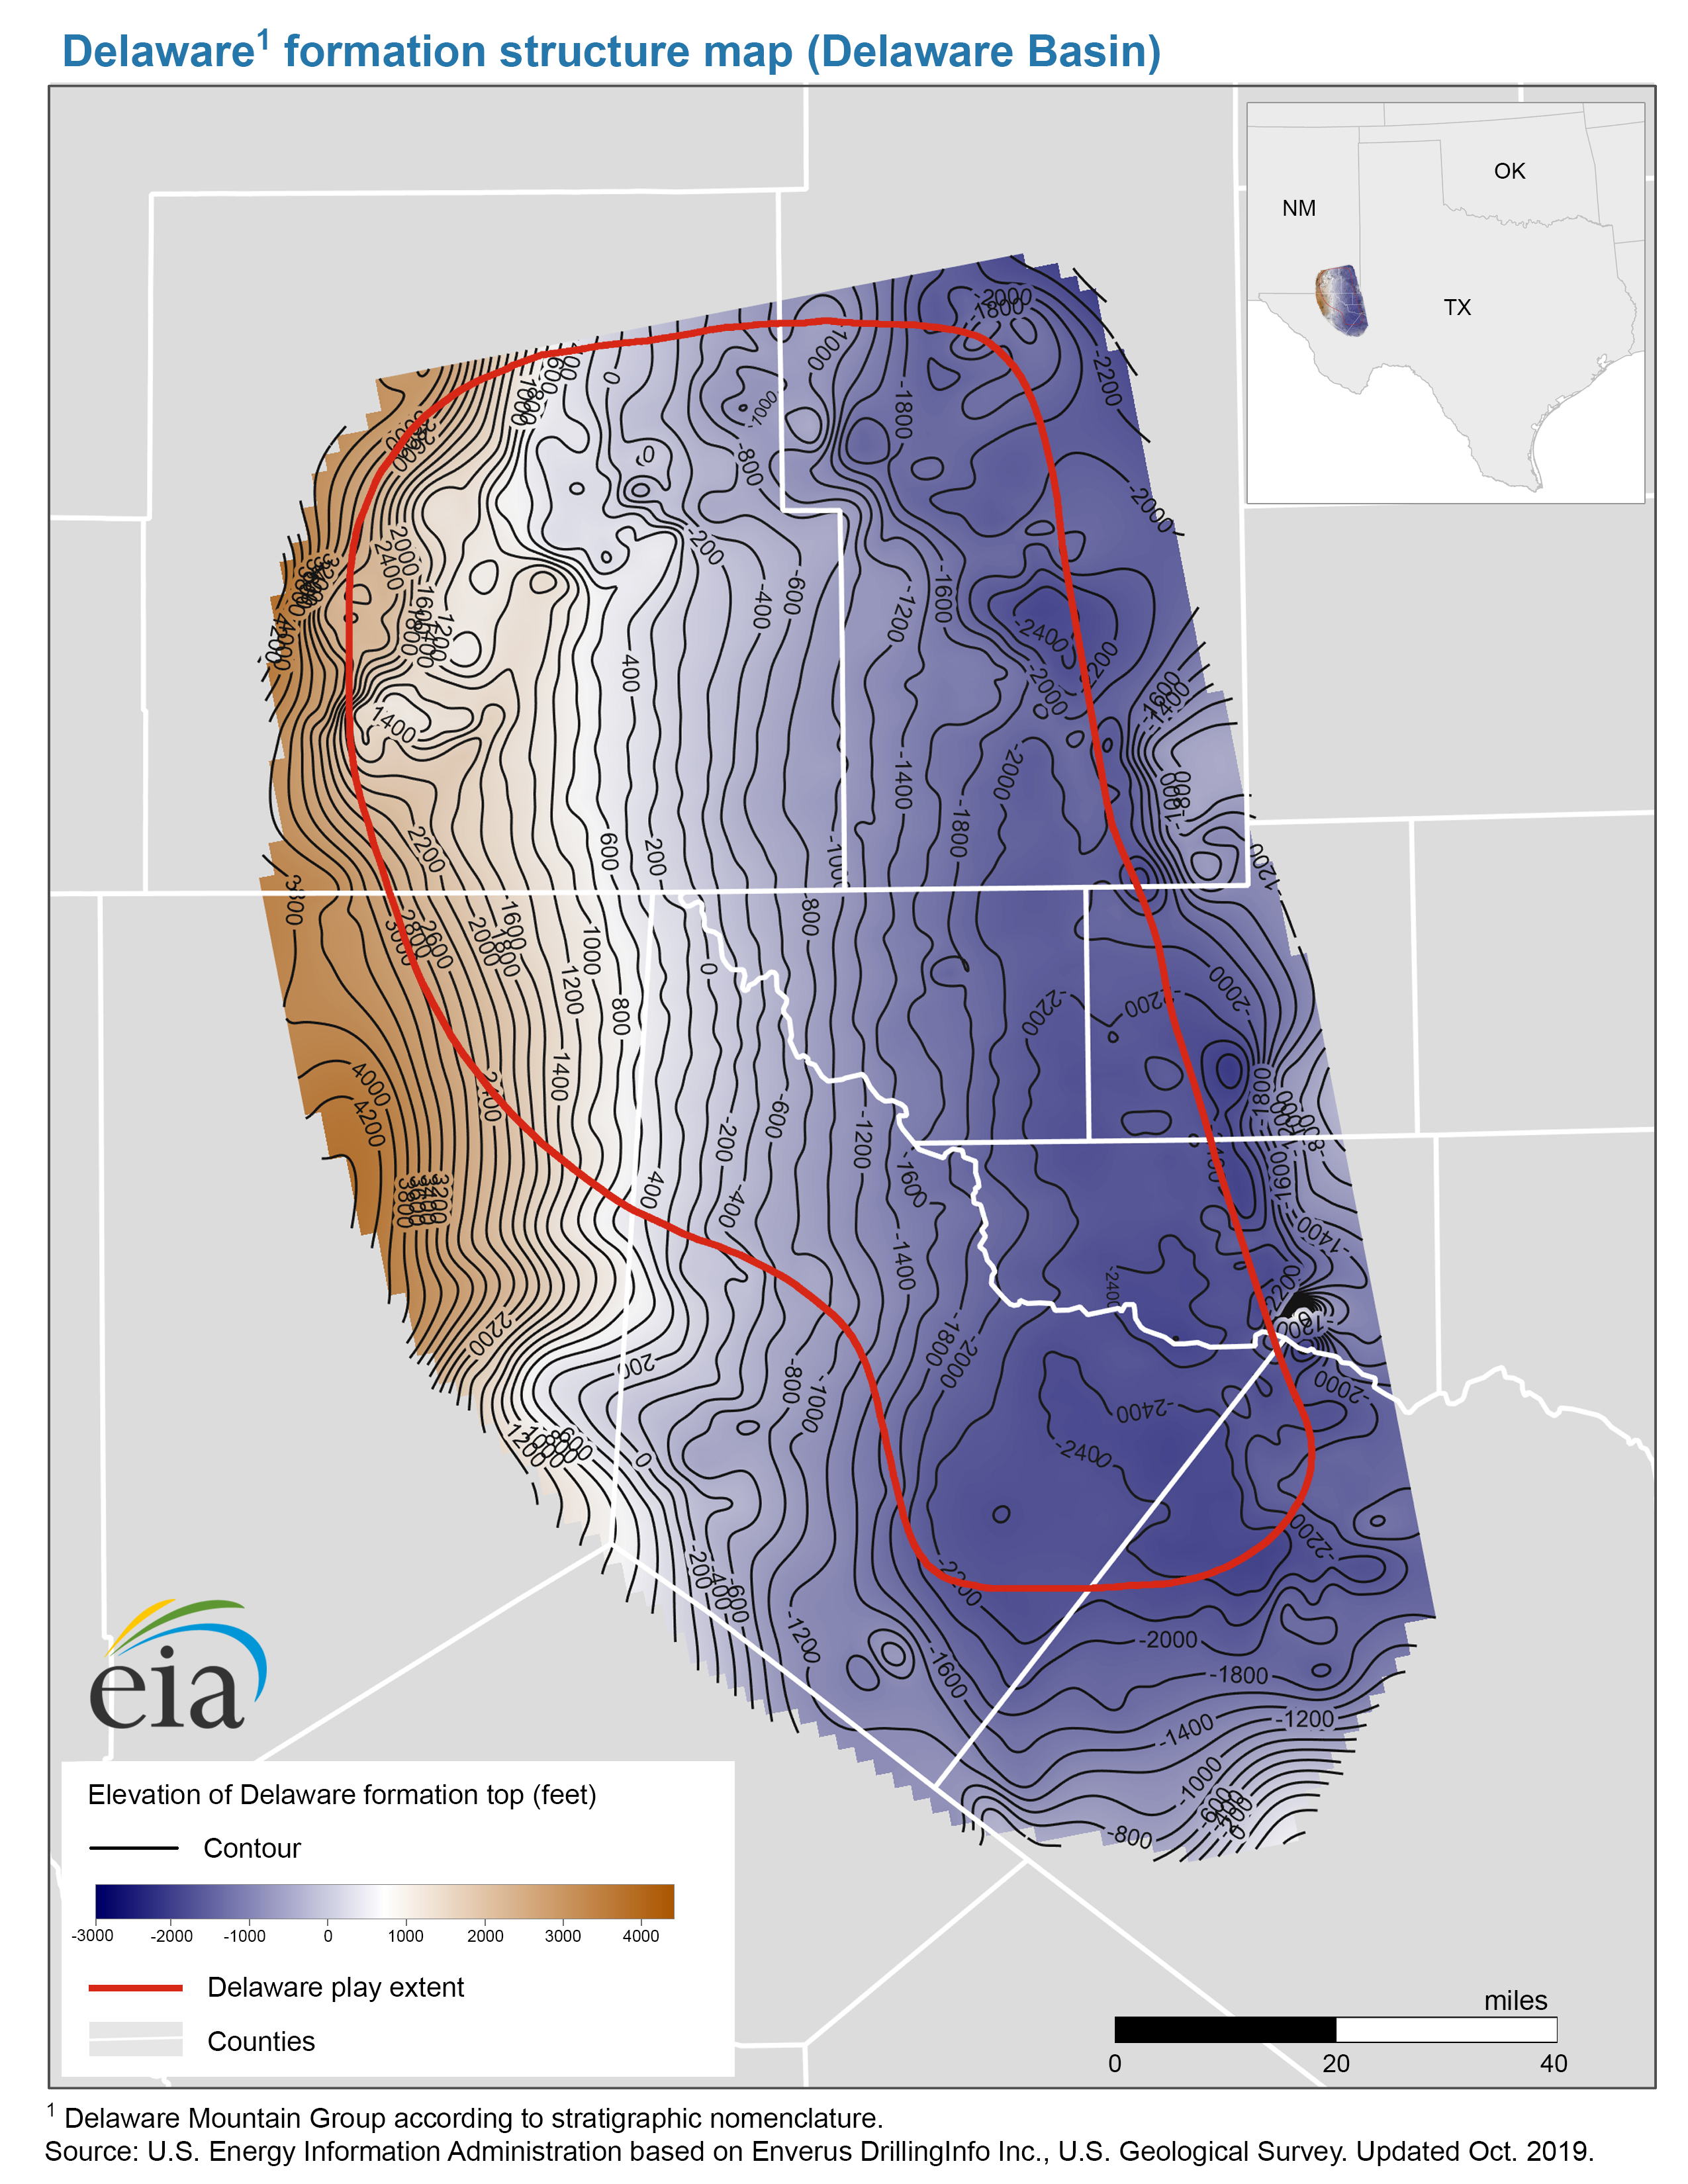
- Delaware formation structure map (Delaware Basin) (10/28/2019) PDF JPG
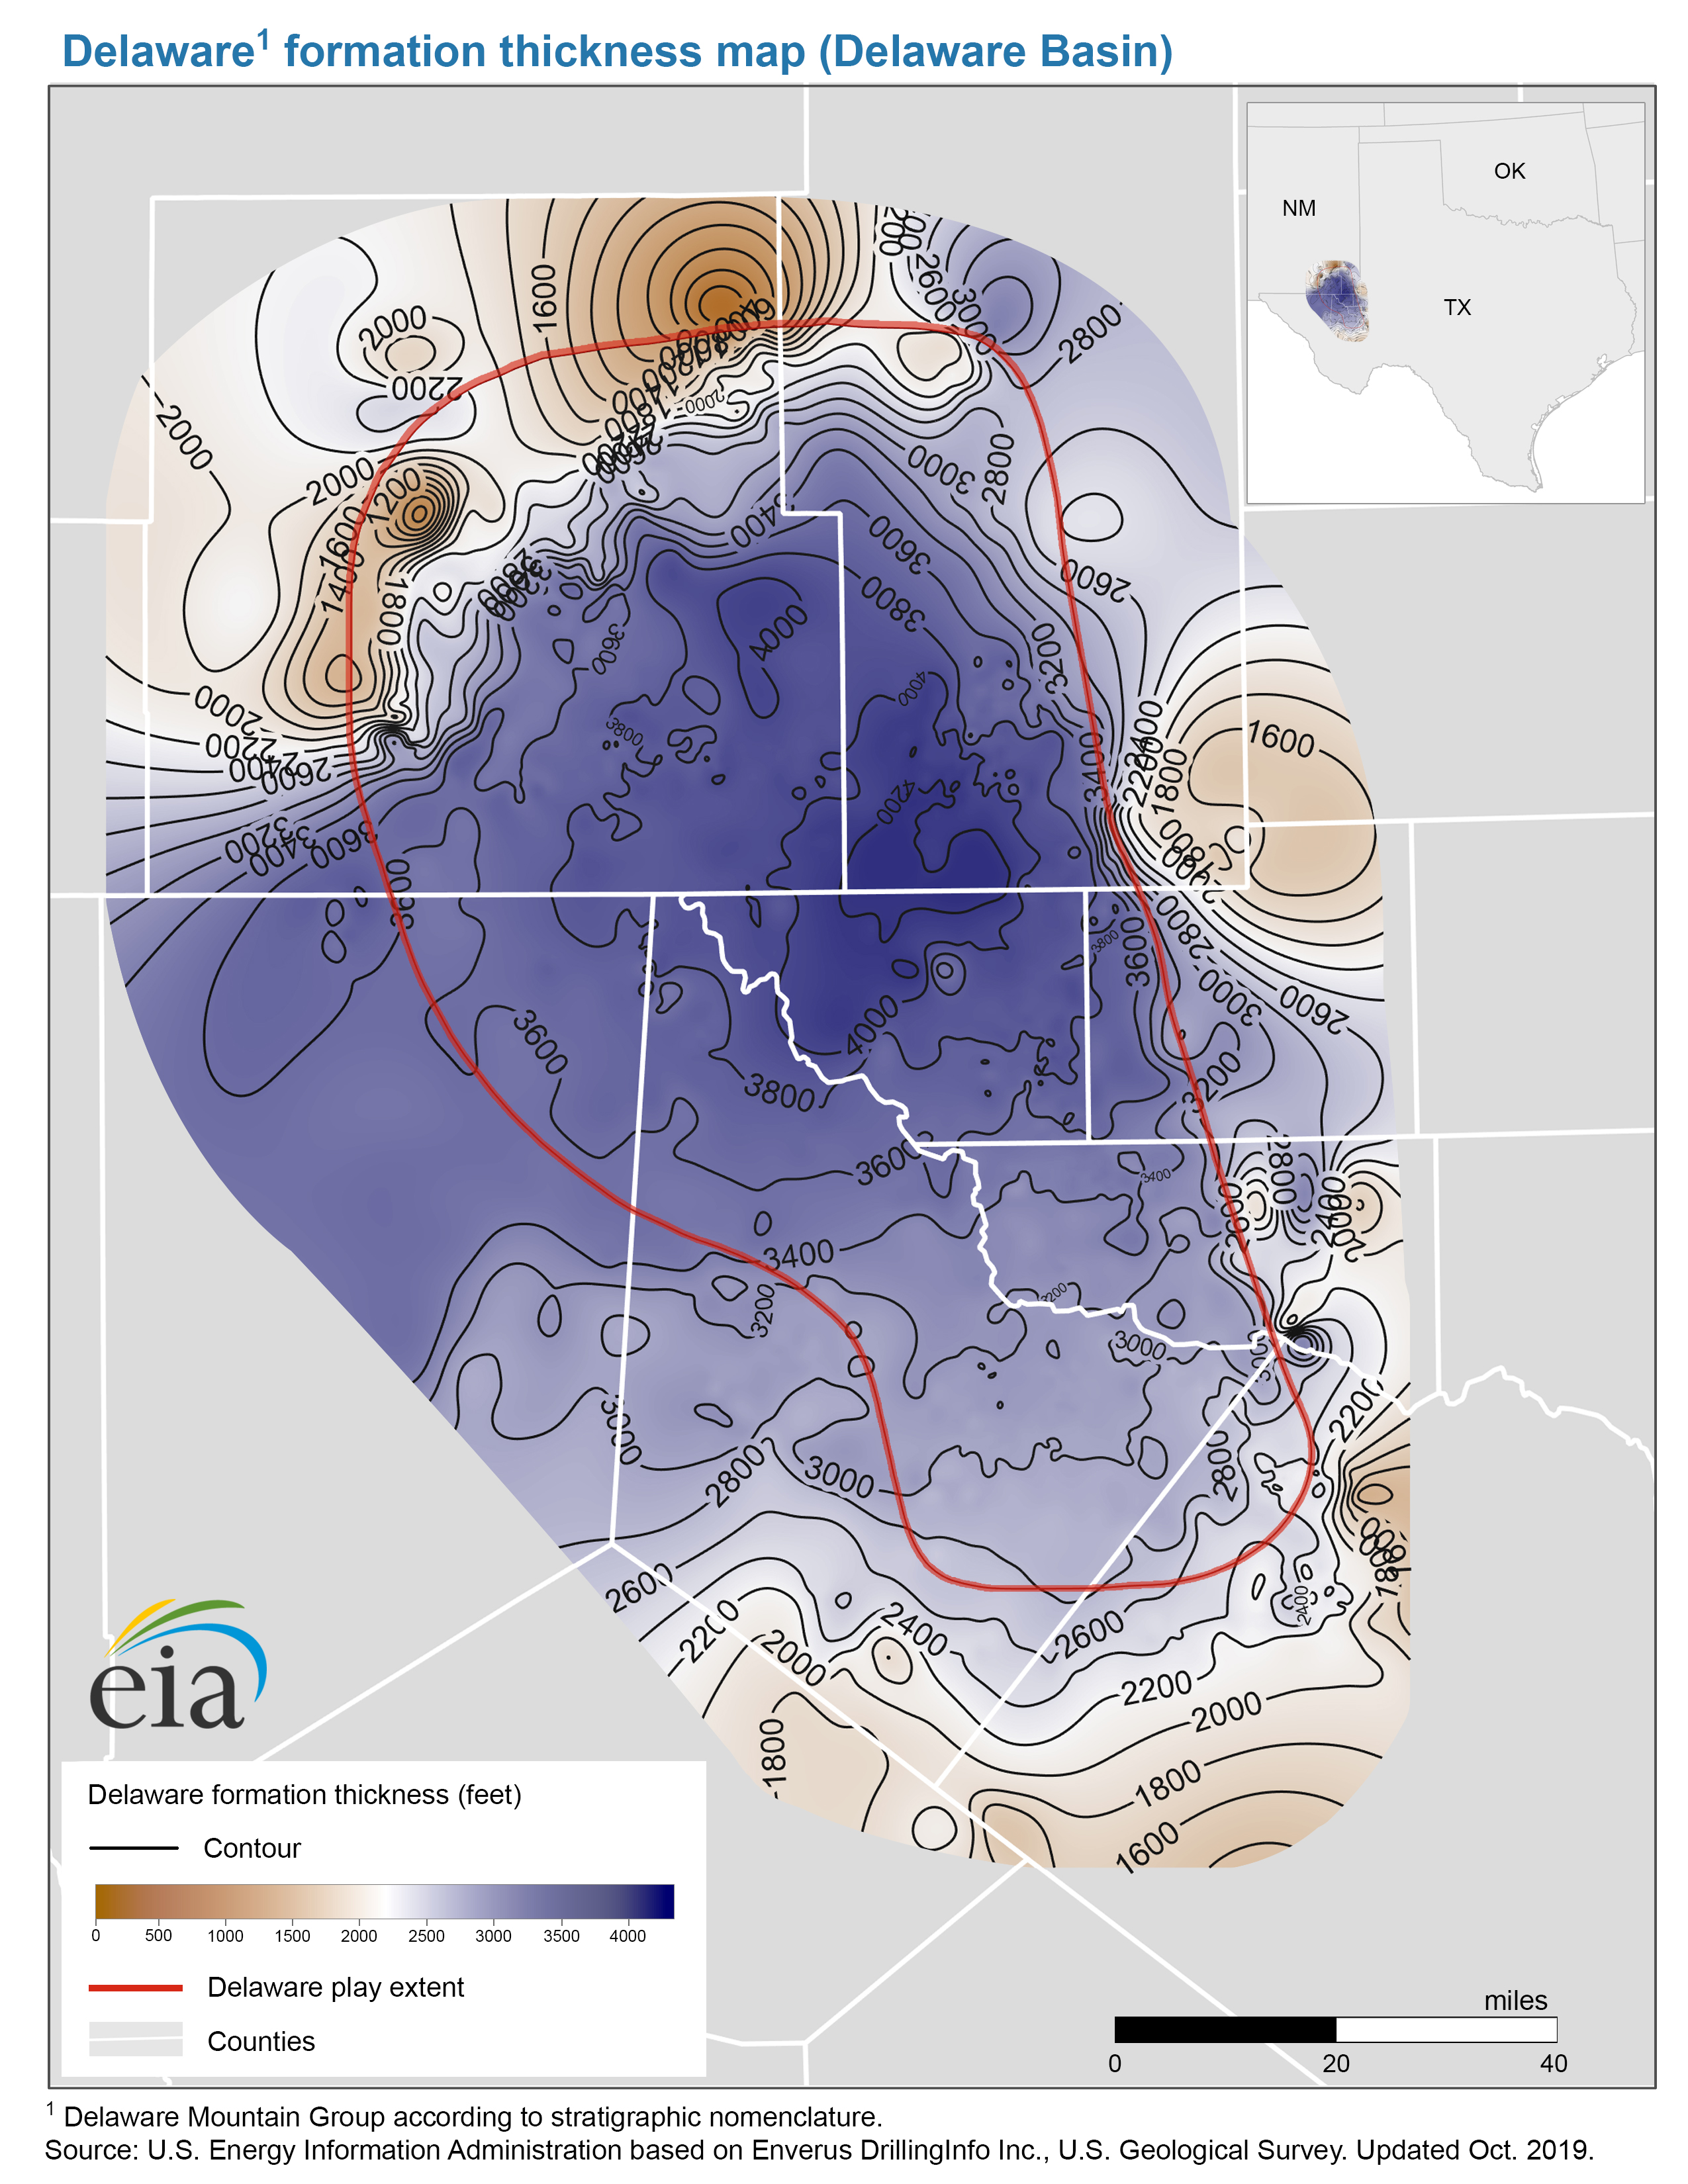
- Delaware formation thickness map (Delaware Basin) (10/28/2019) PDF JPG
Map data
- Delaware play boundary (10/8/2019) Shapefile
- Delaware formation structure and isopachs (10/29/2019) Shapefile
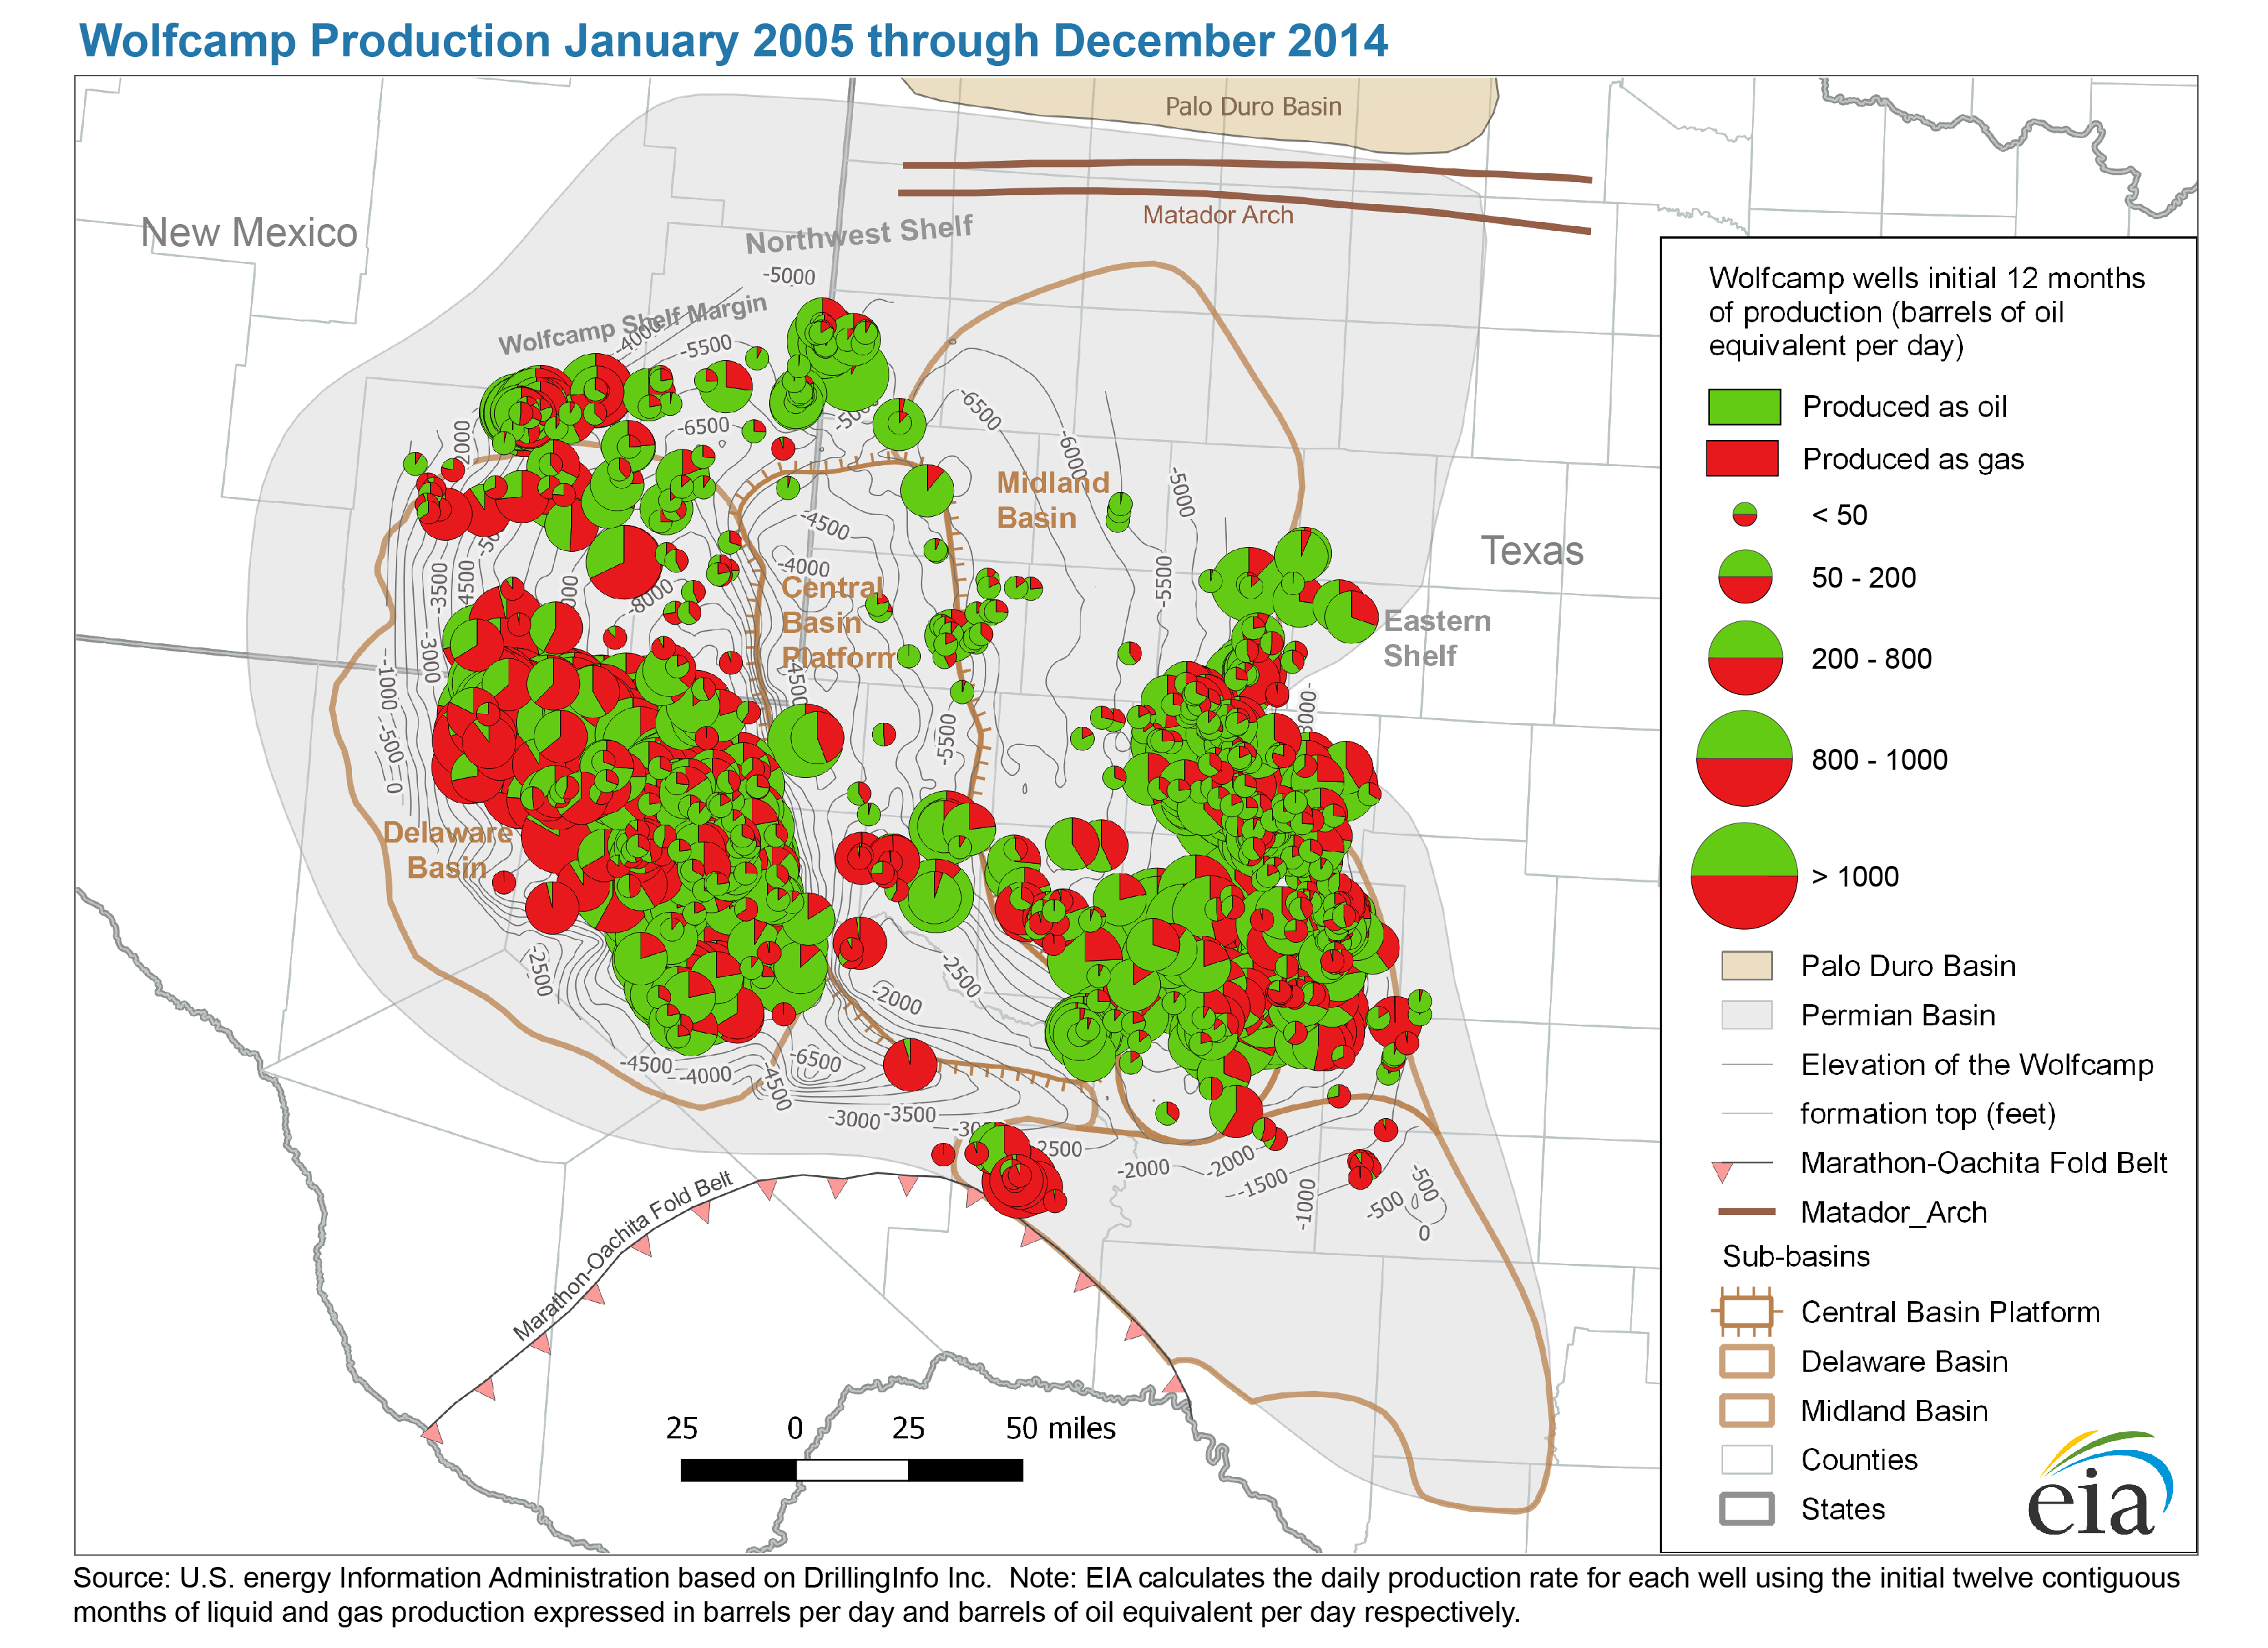
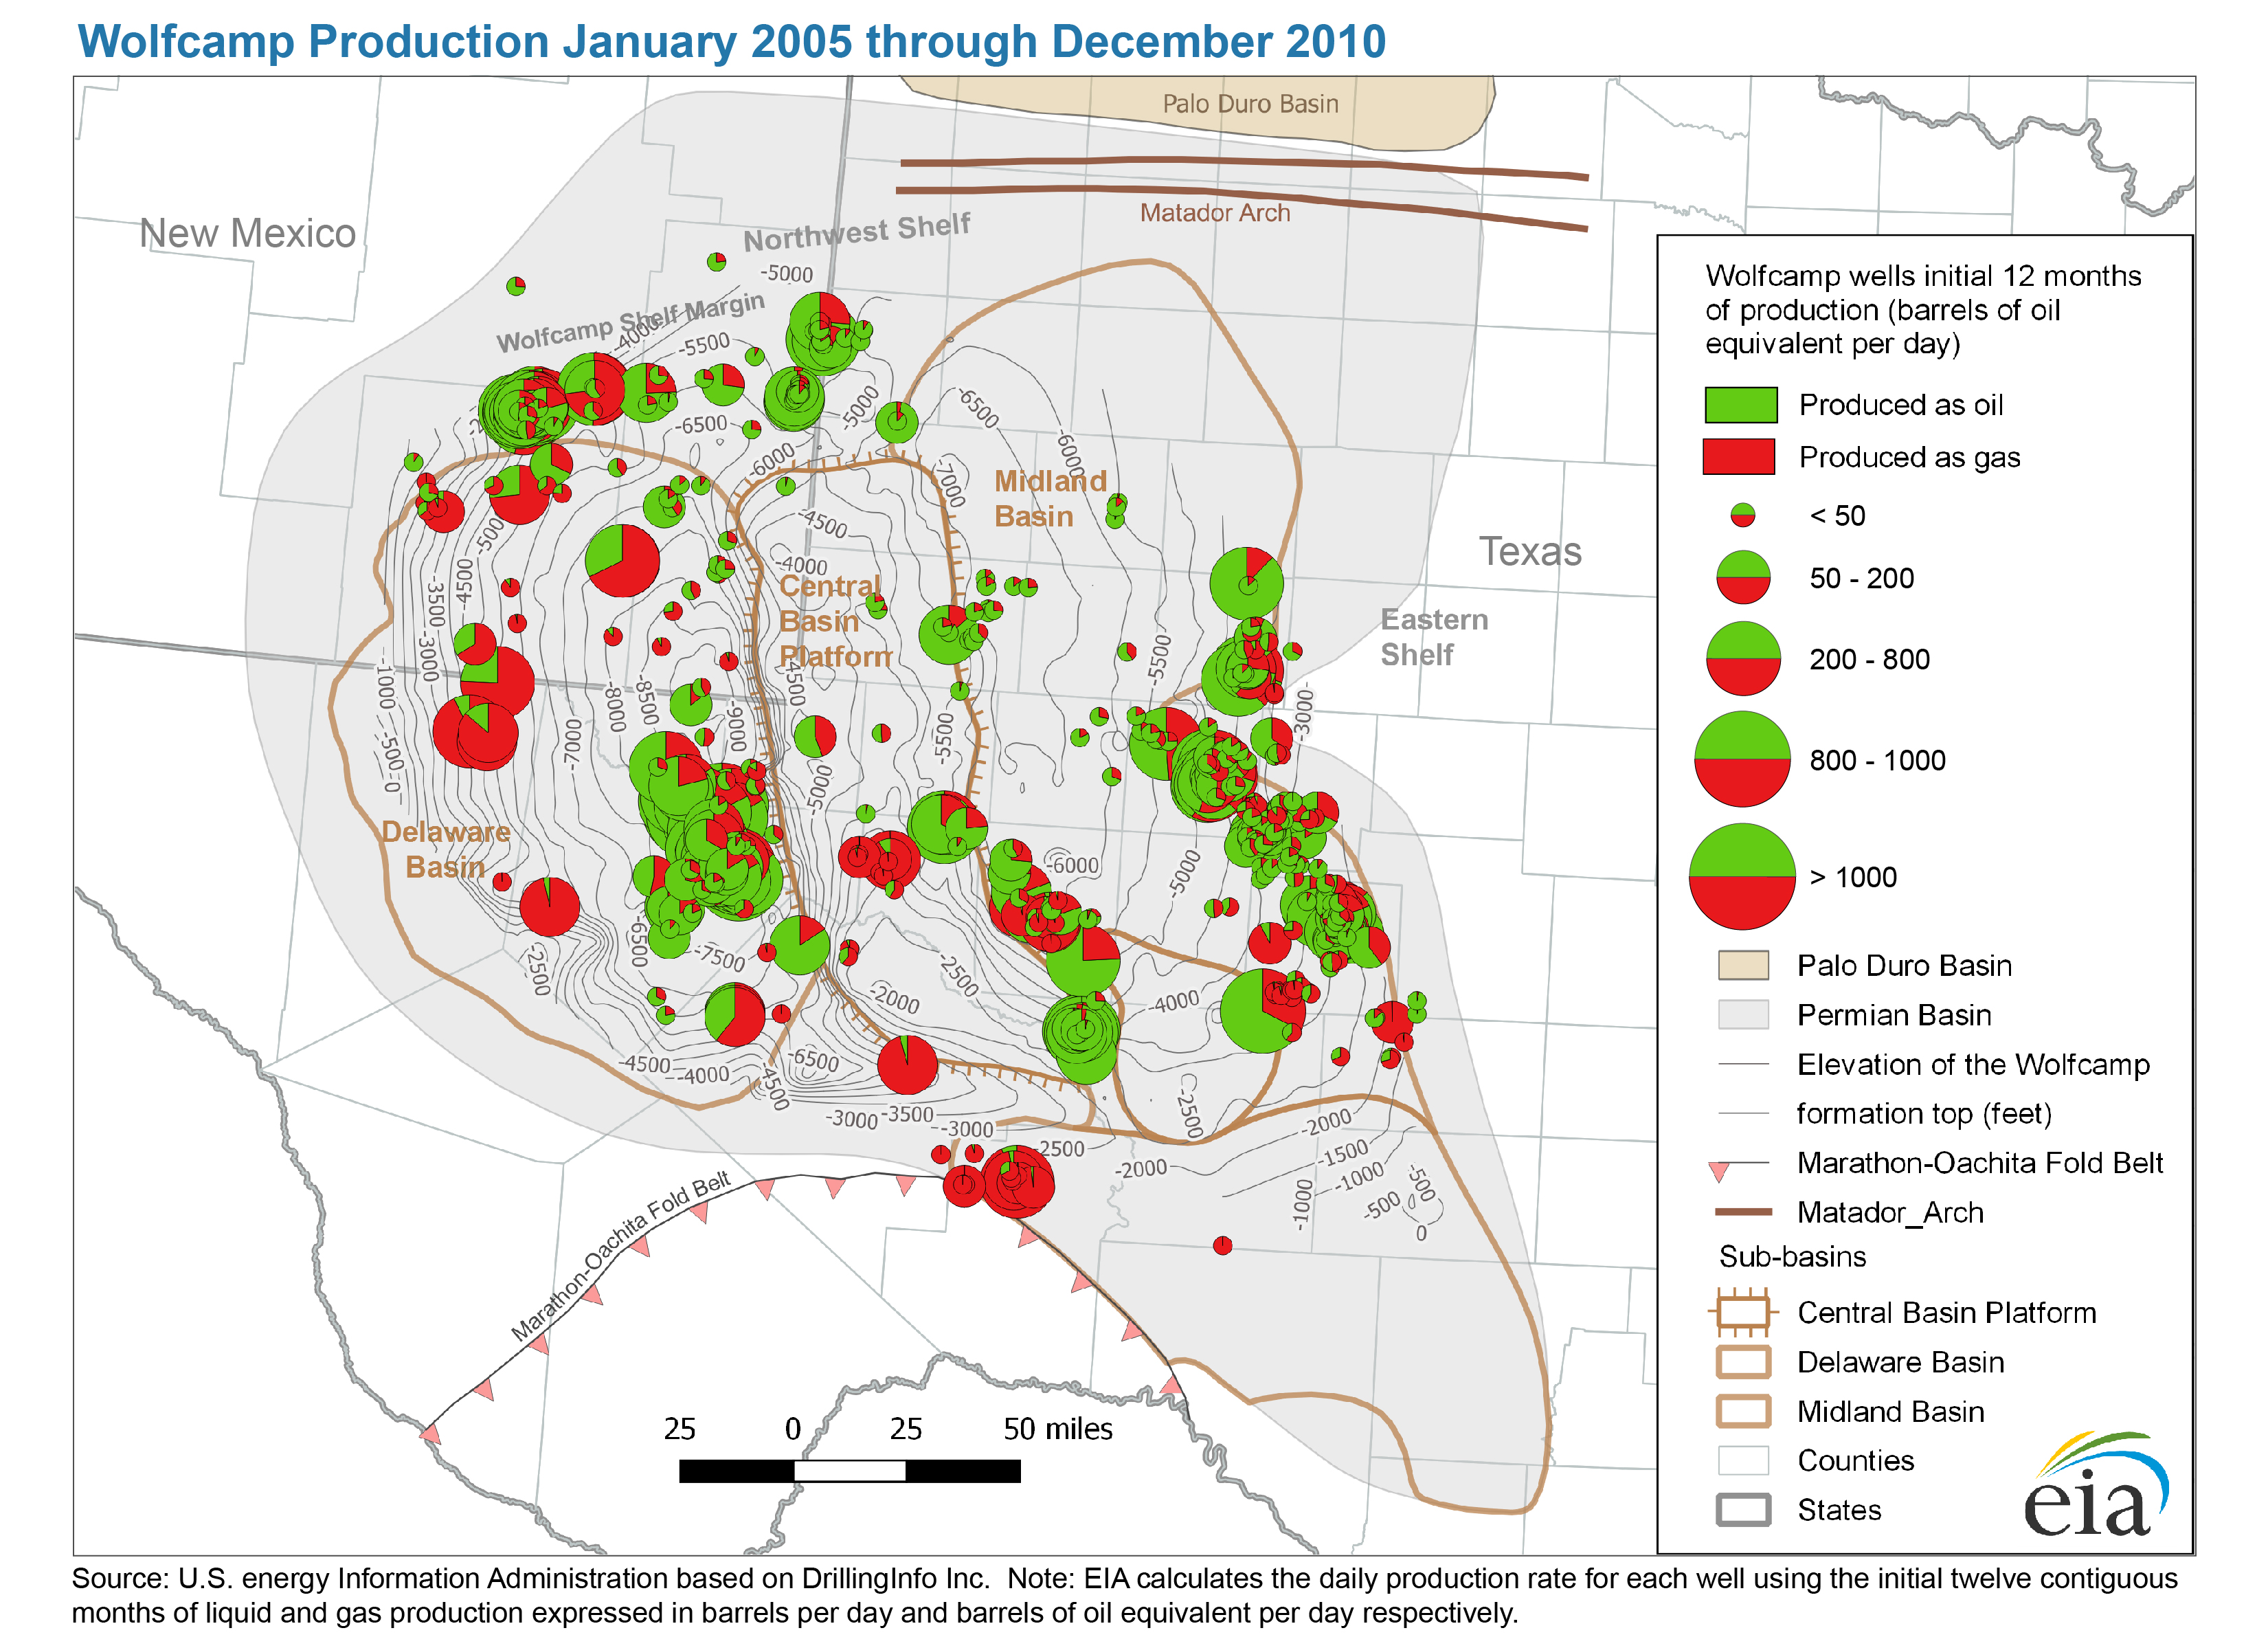
Wolfcamp formation
Map data
- Permian Basin: Wolfcamp formation elevation and isopachs (12/21/2017) Shapefile
- Permian Basin, Delaware Sub-Basin: Wolfcamp play boundary (9/4/2018) Shapefile
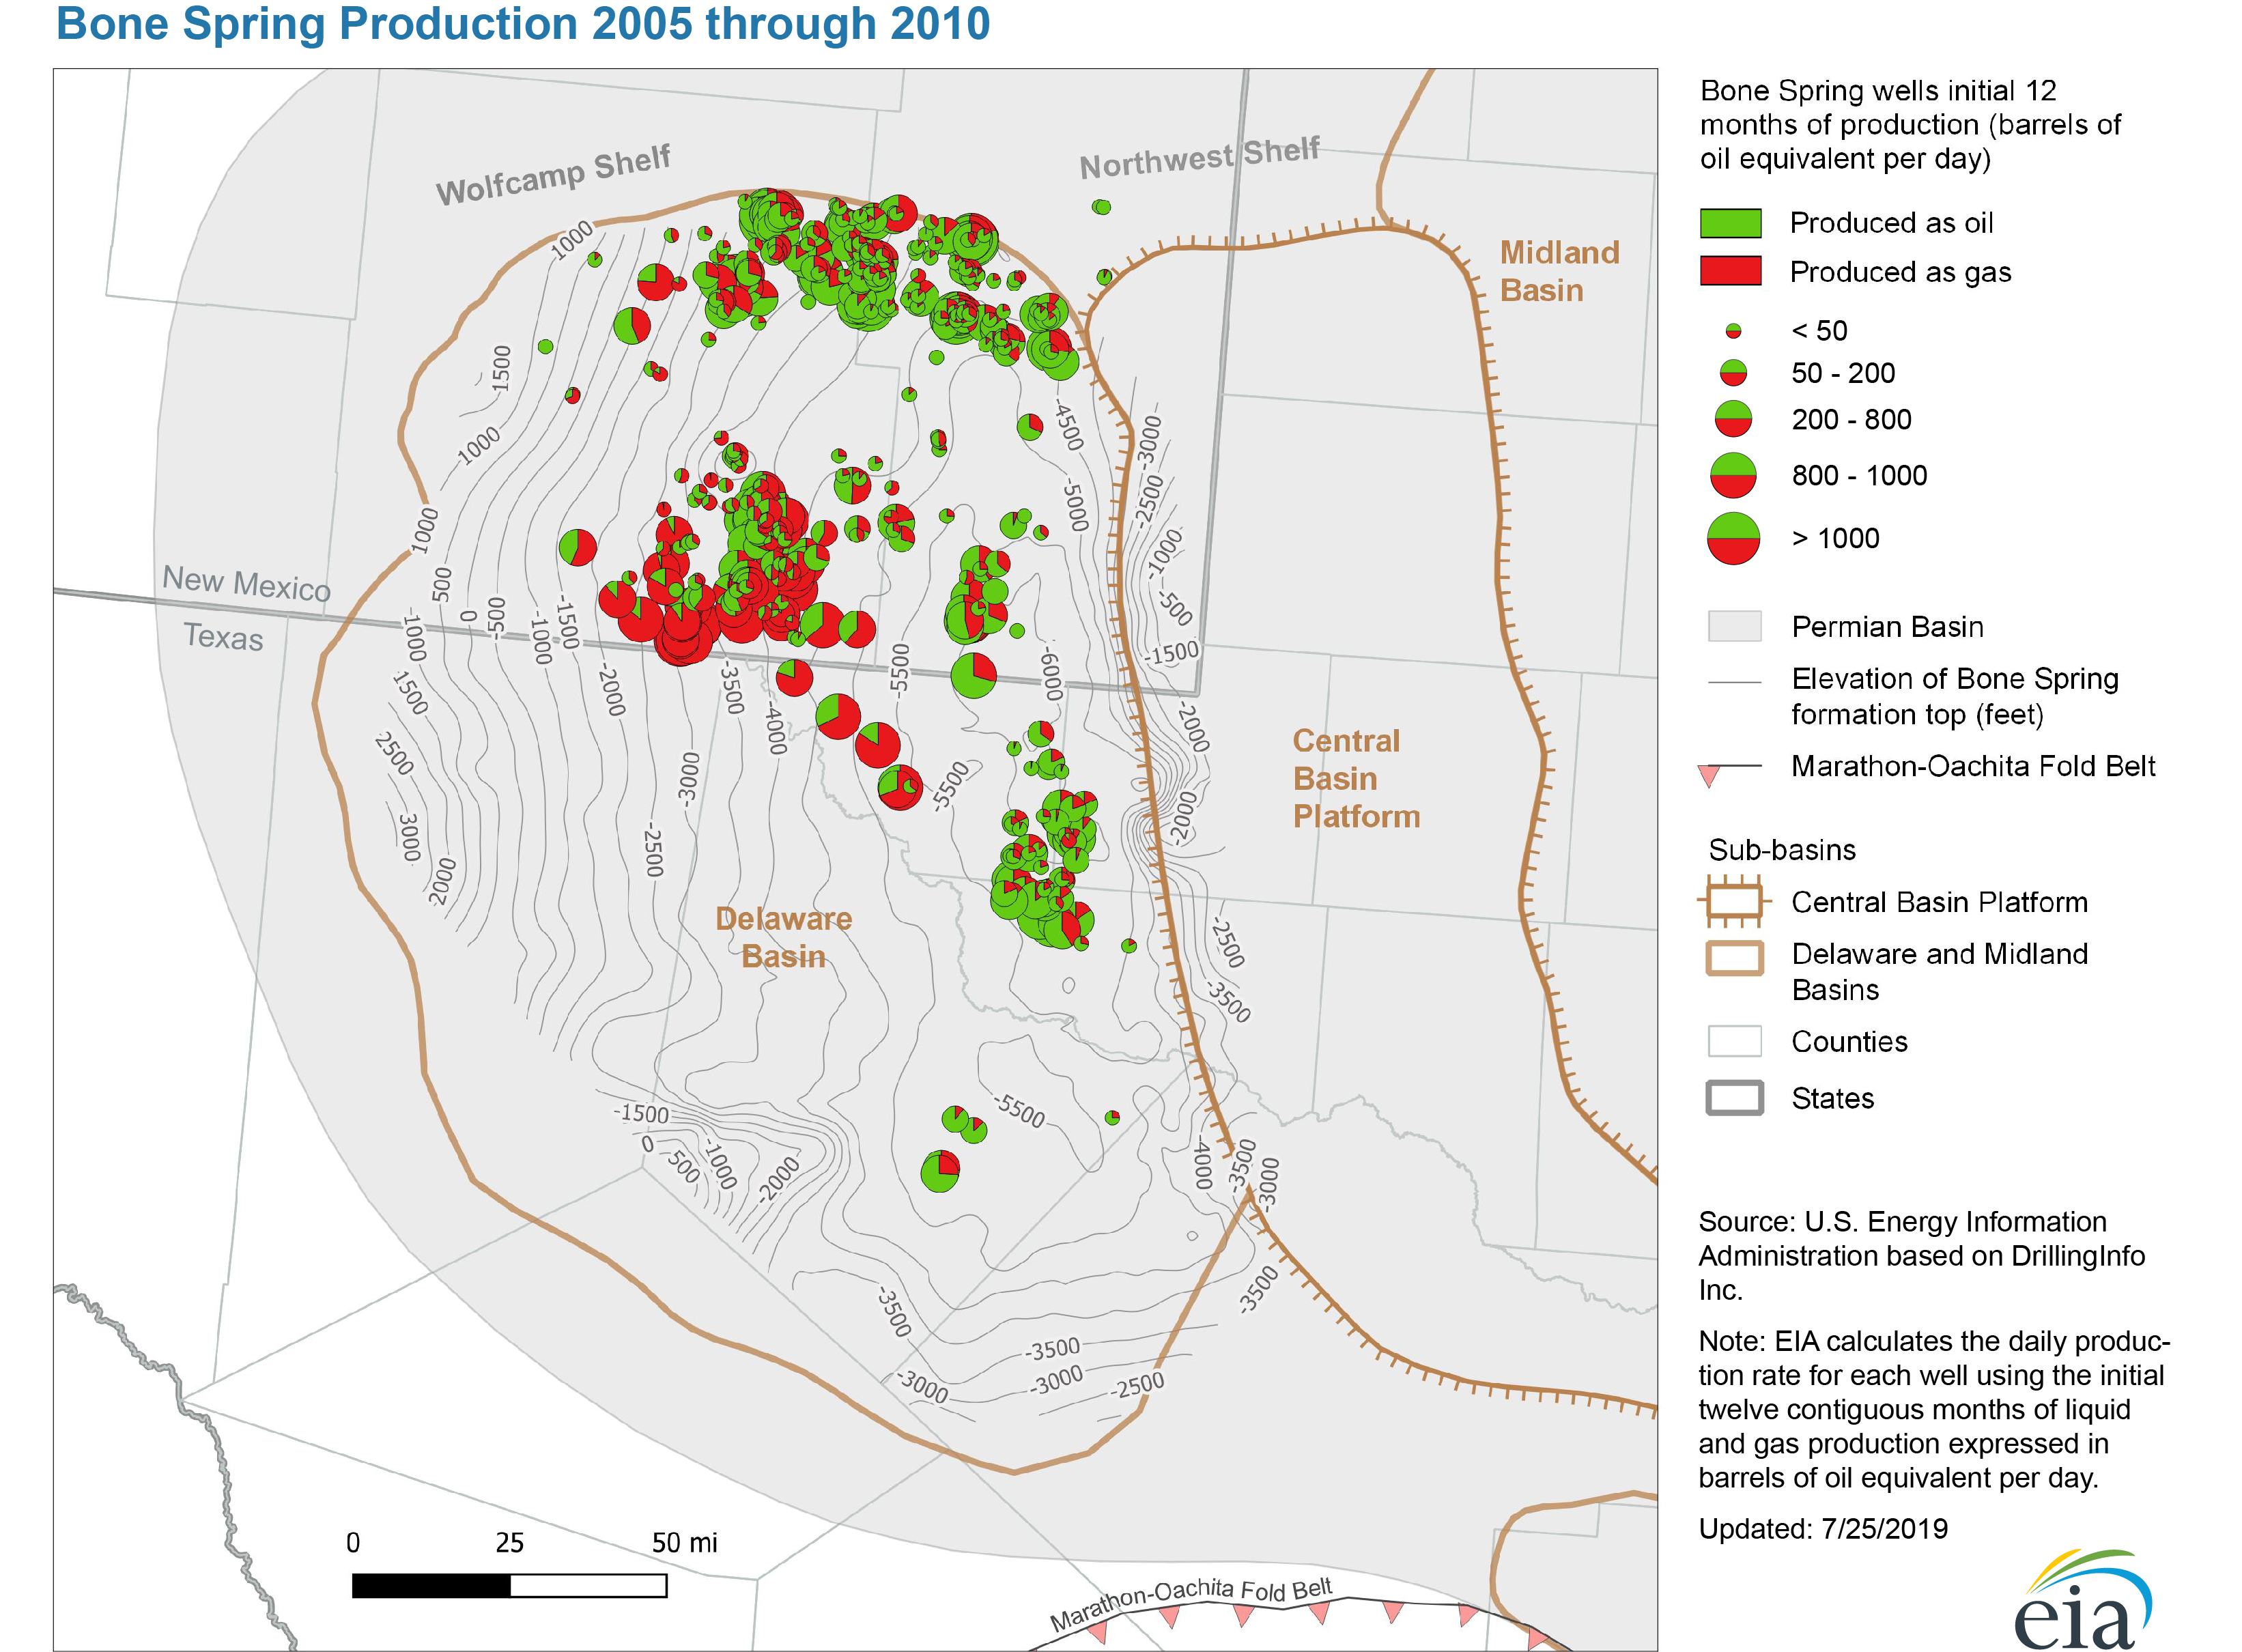
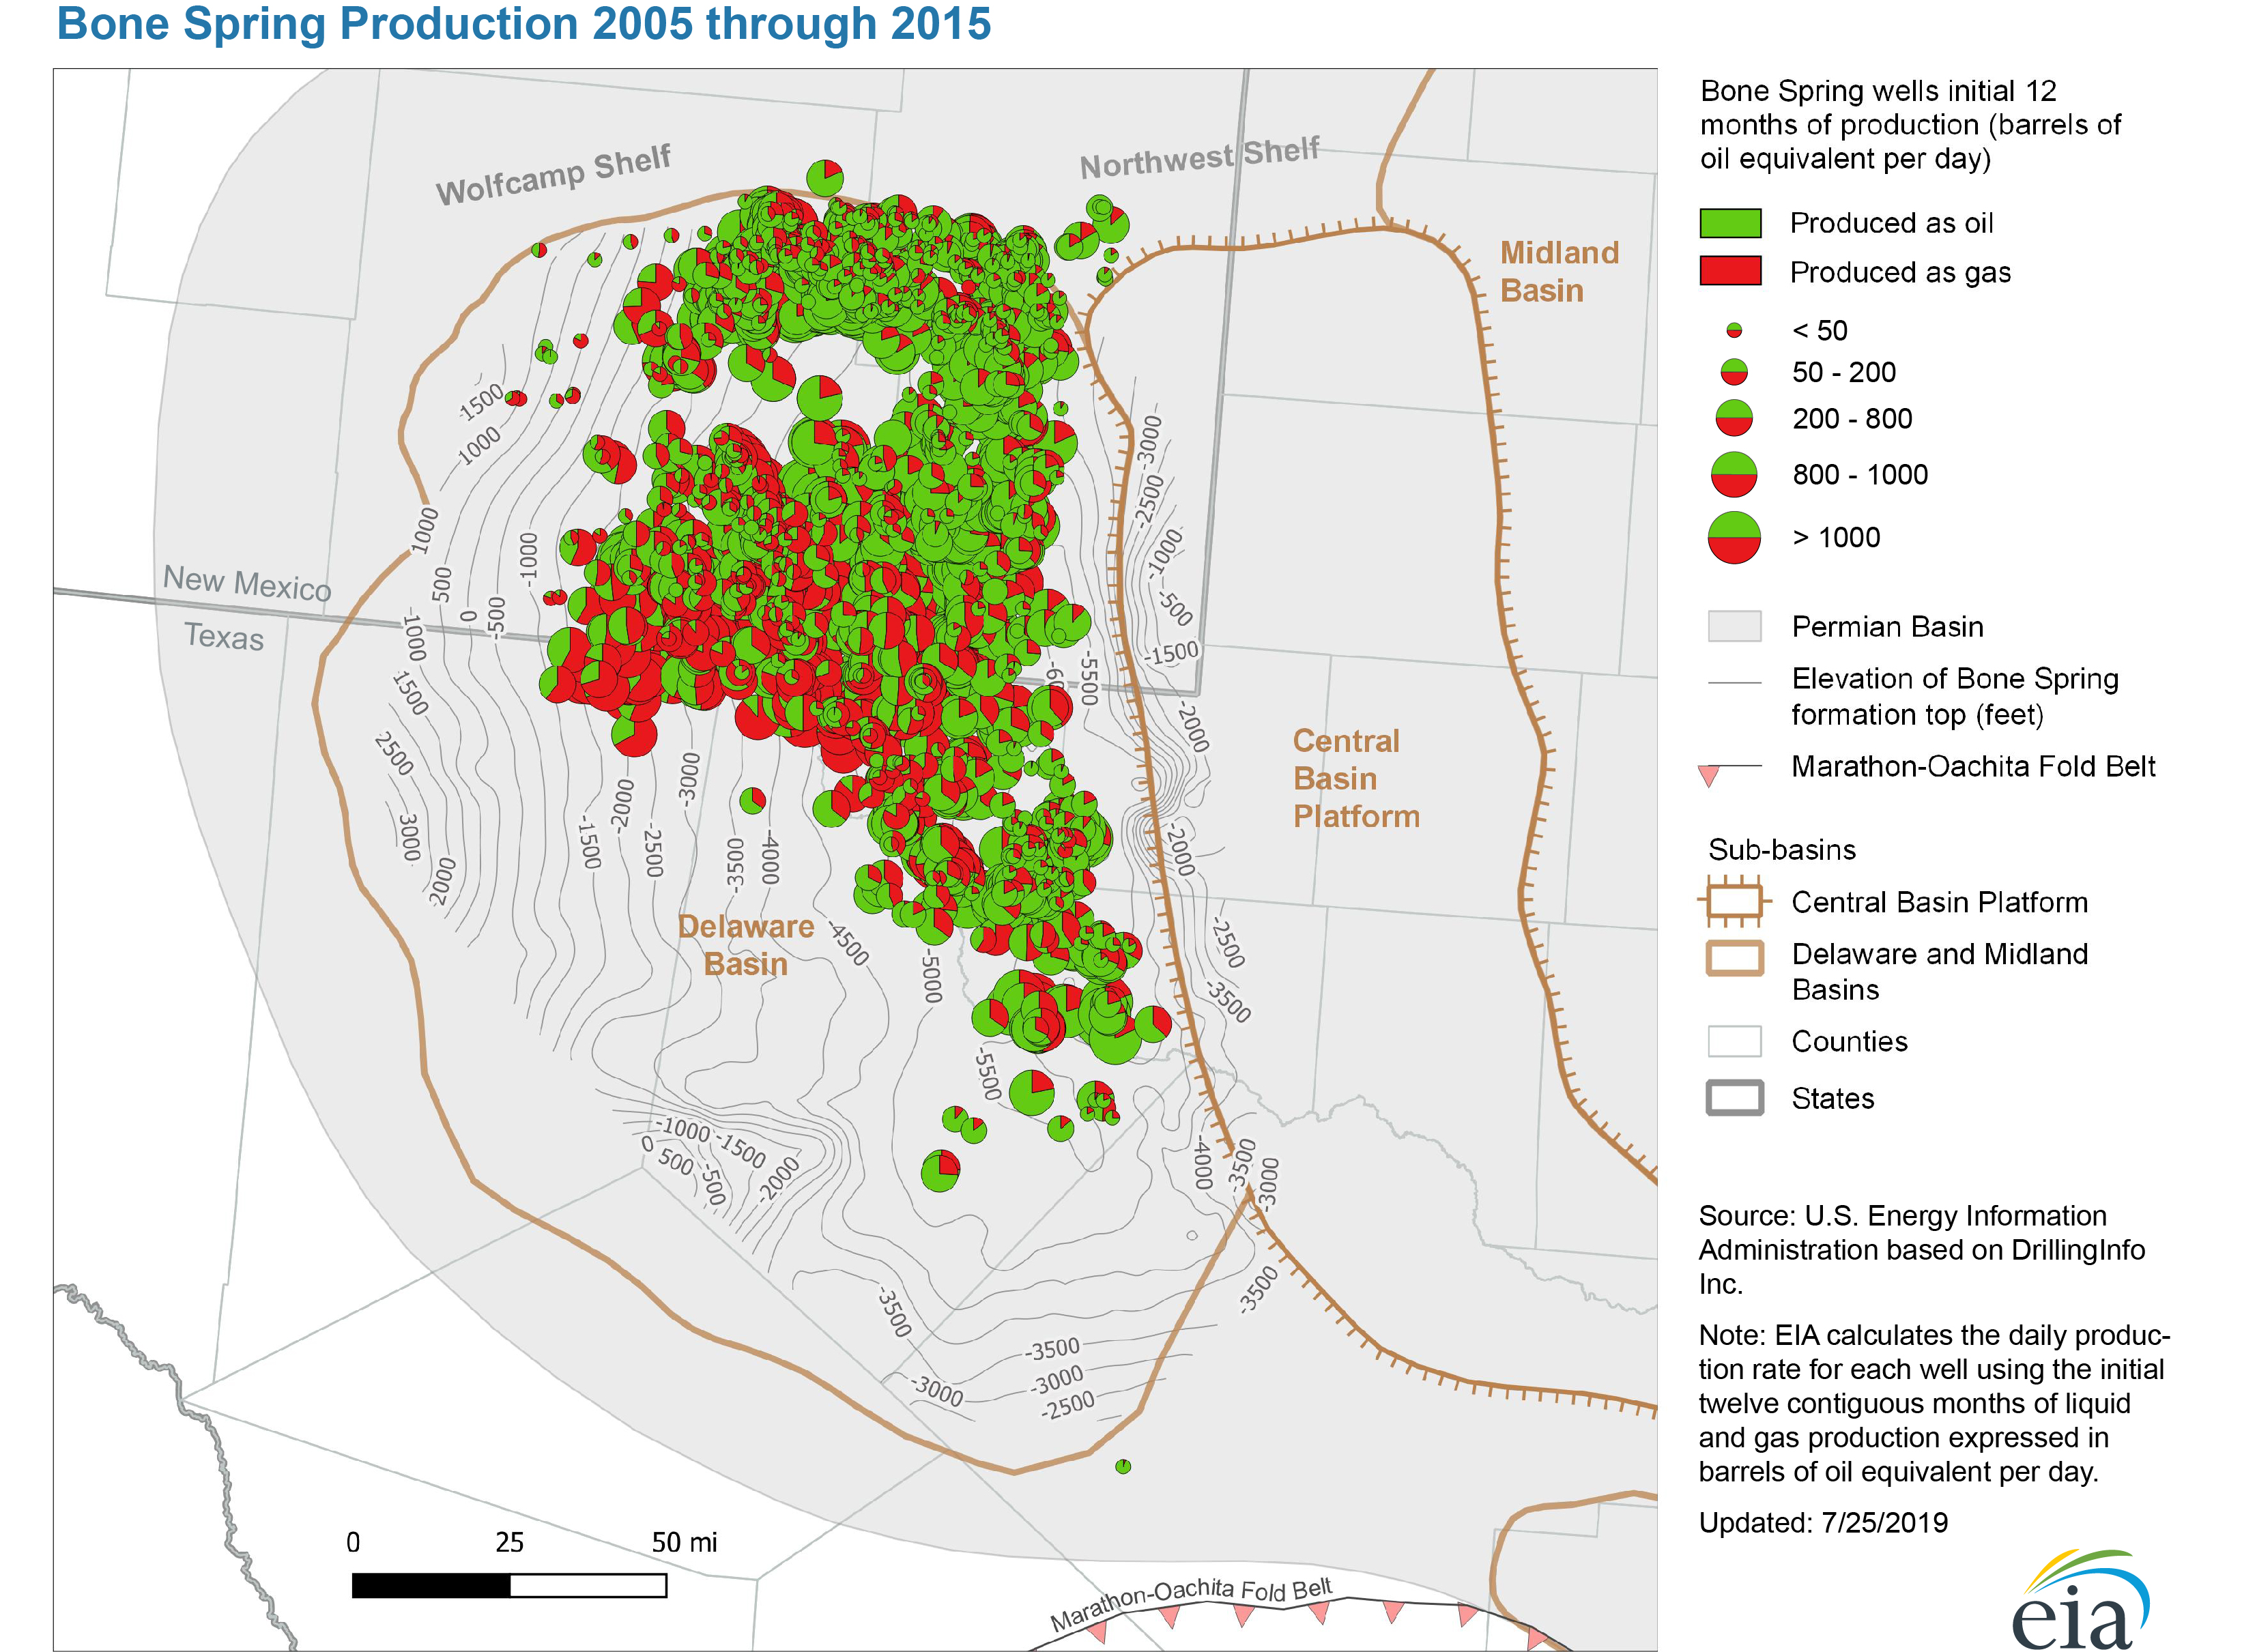
Bone Spring formation benches
- Bone Spring Production 2005 through 2010 (7/25/2019) PDF JPG
- Bone Spring Production 2005 through 2015 (7/25/2019) PDF JPG
- Bone Spring Production 2005 through June 2019 (7/25/2019) PDF JPG
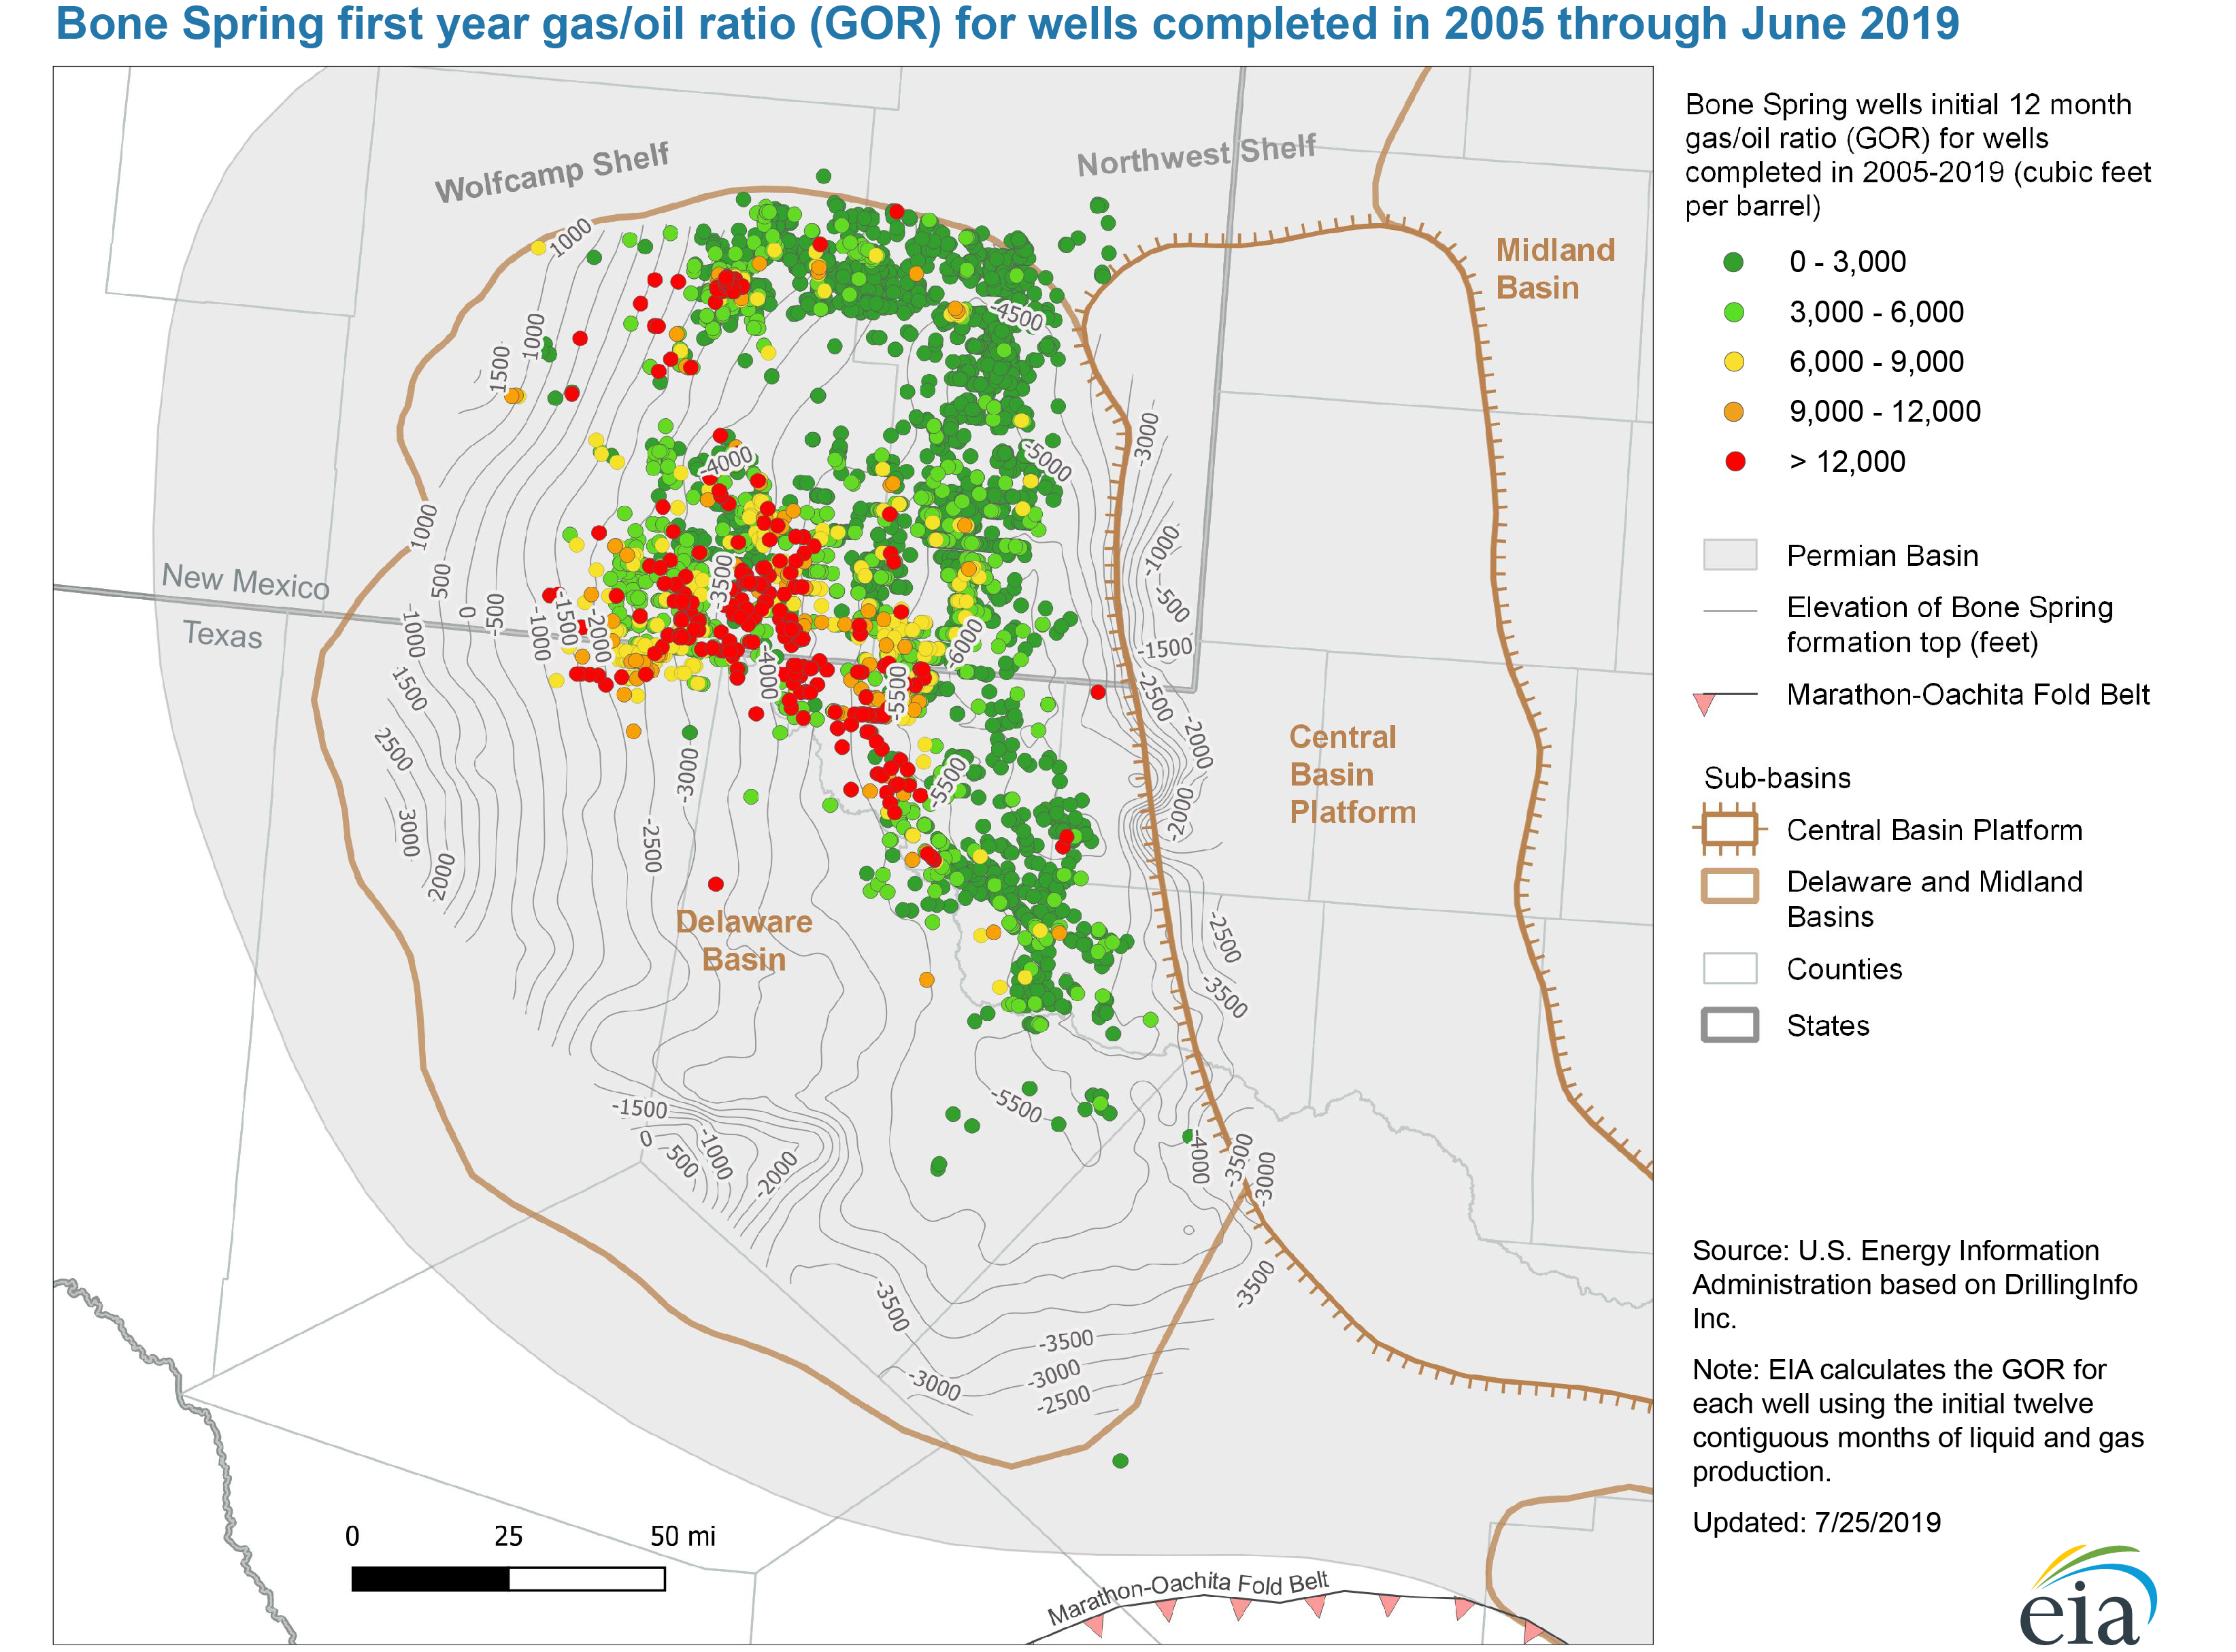
- Bone Spring first year gas/oil ratio (GOR) for wells completed 2005 through June 2019 (7/25/2019) PDF JPG
- Structure map of the Avalon Bone Spring formation, Delaware Basin (3/4/2019) PDF JPG
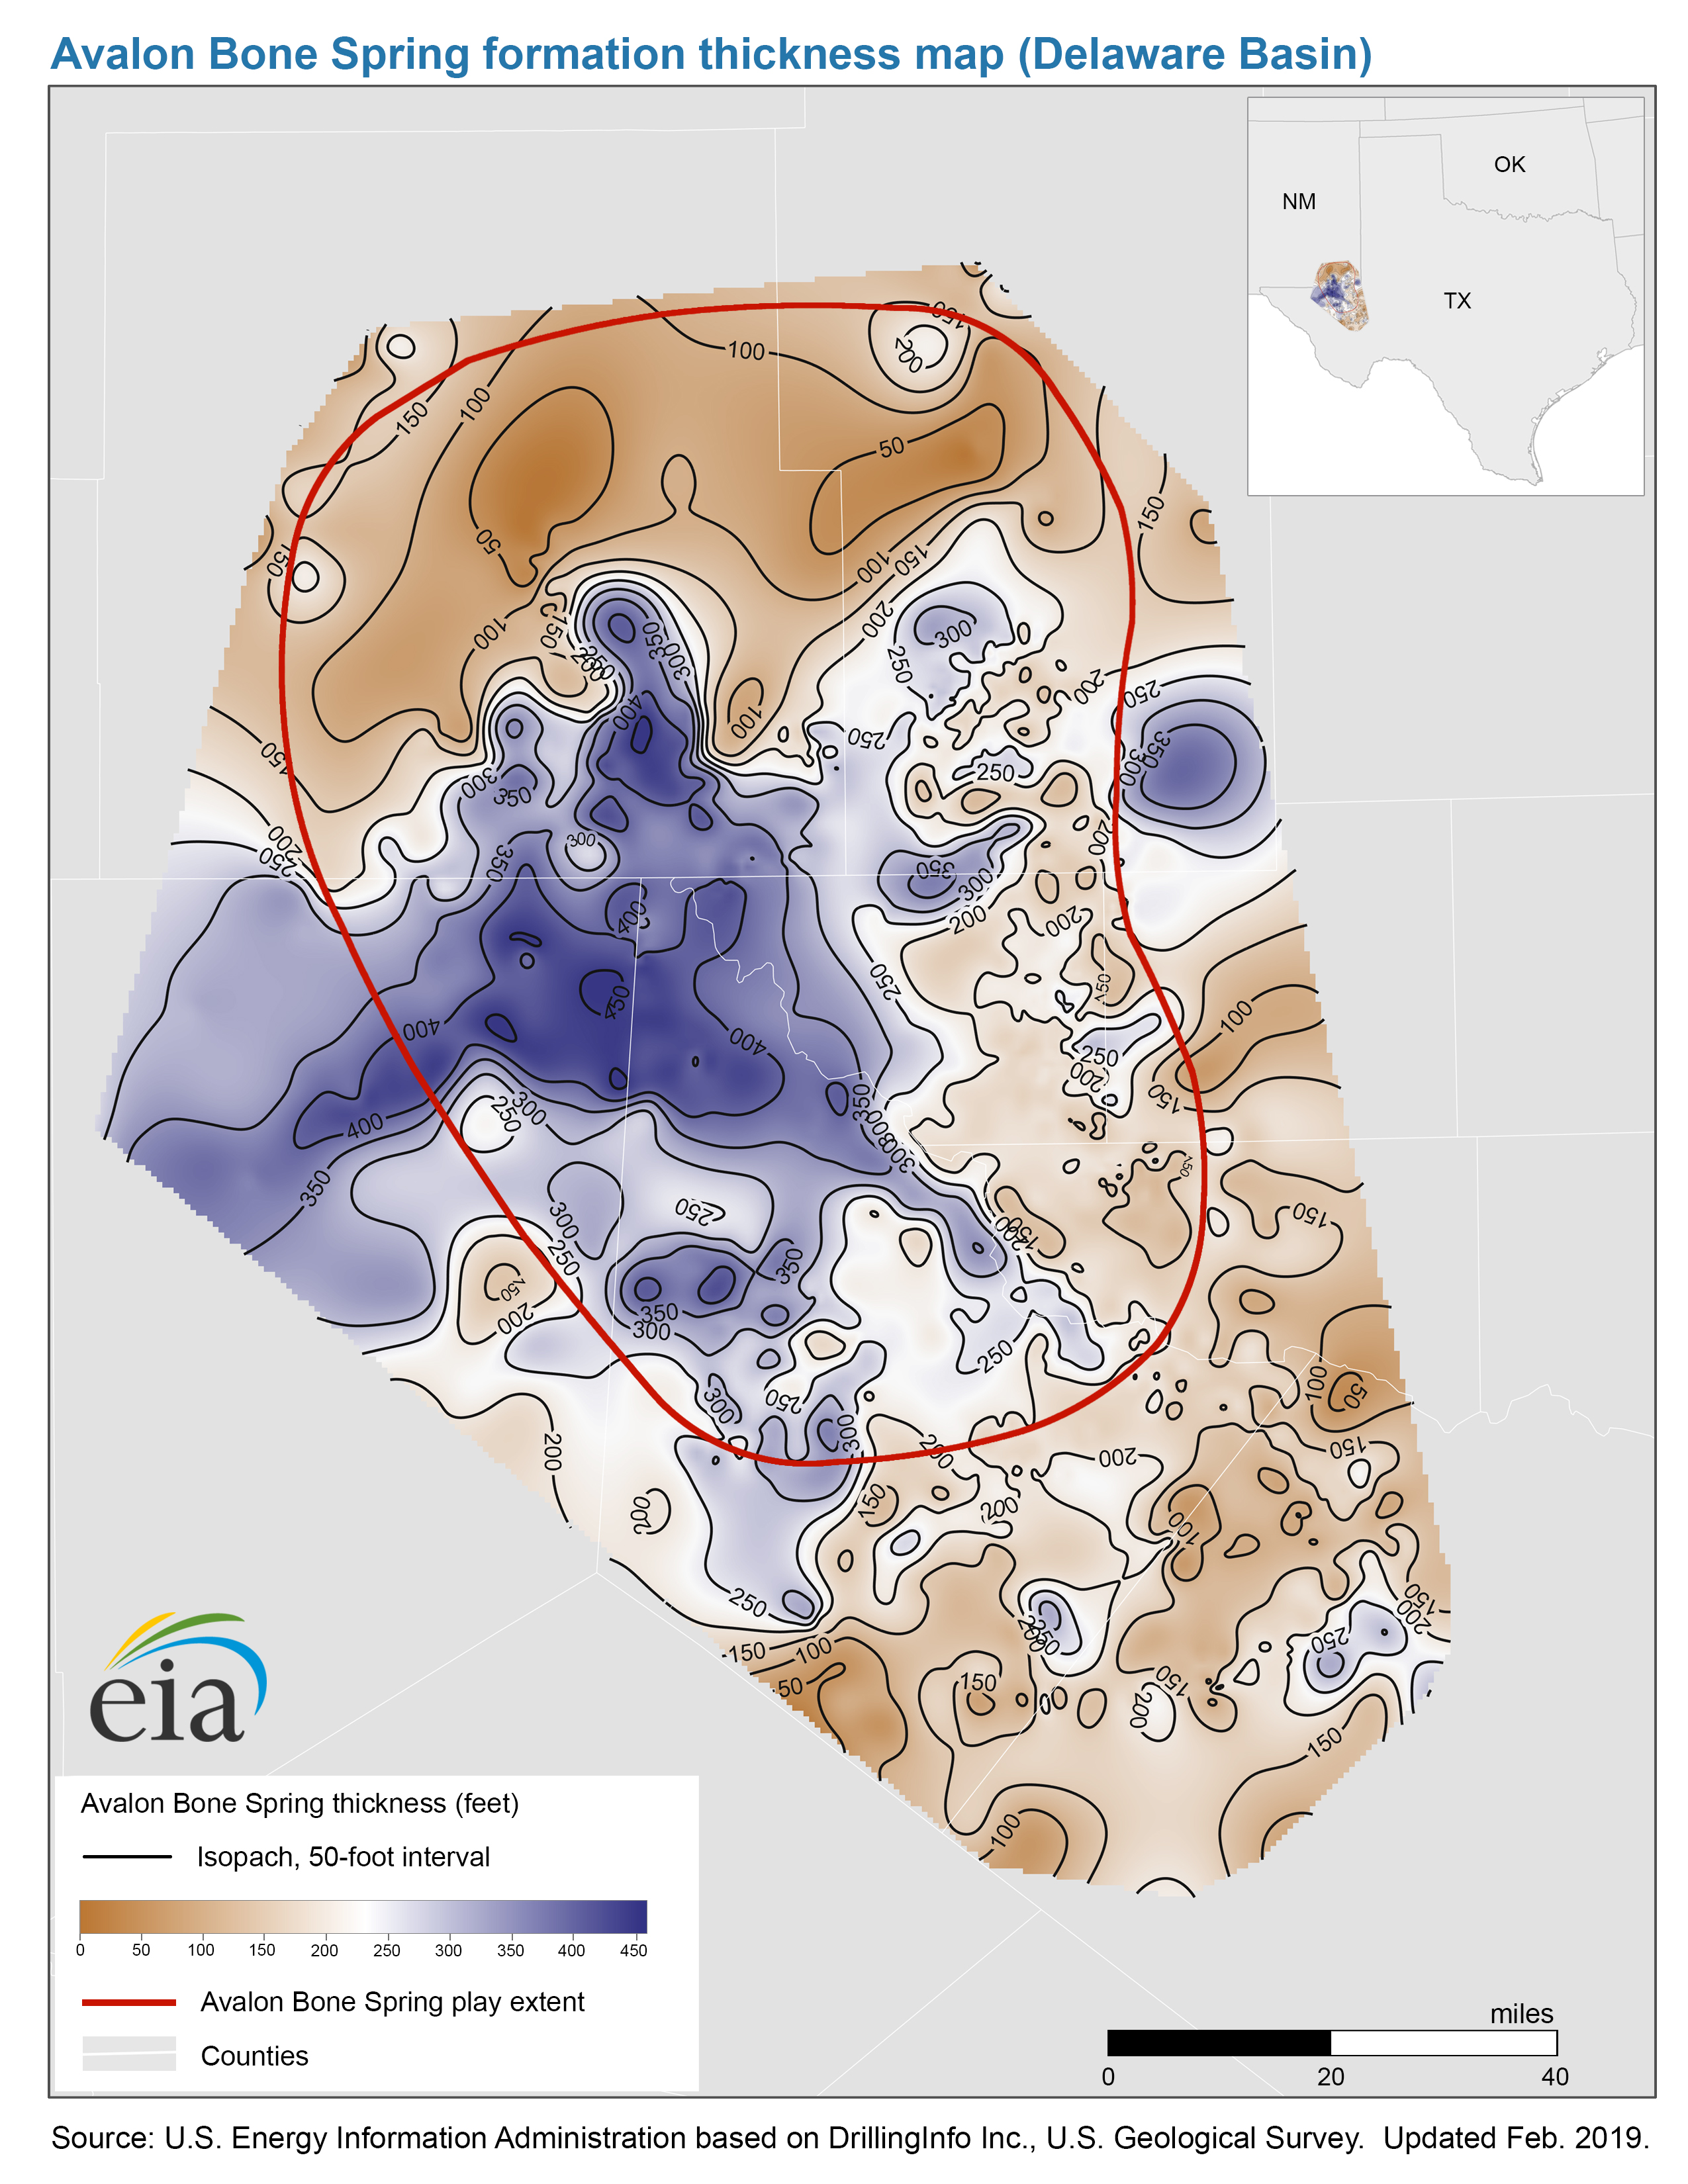
- Thickness map of the Avalon Bone Spring formation, Delaware Basin (3/4/2019) PDF JPG
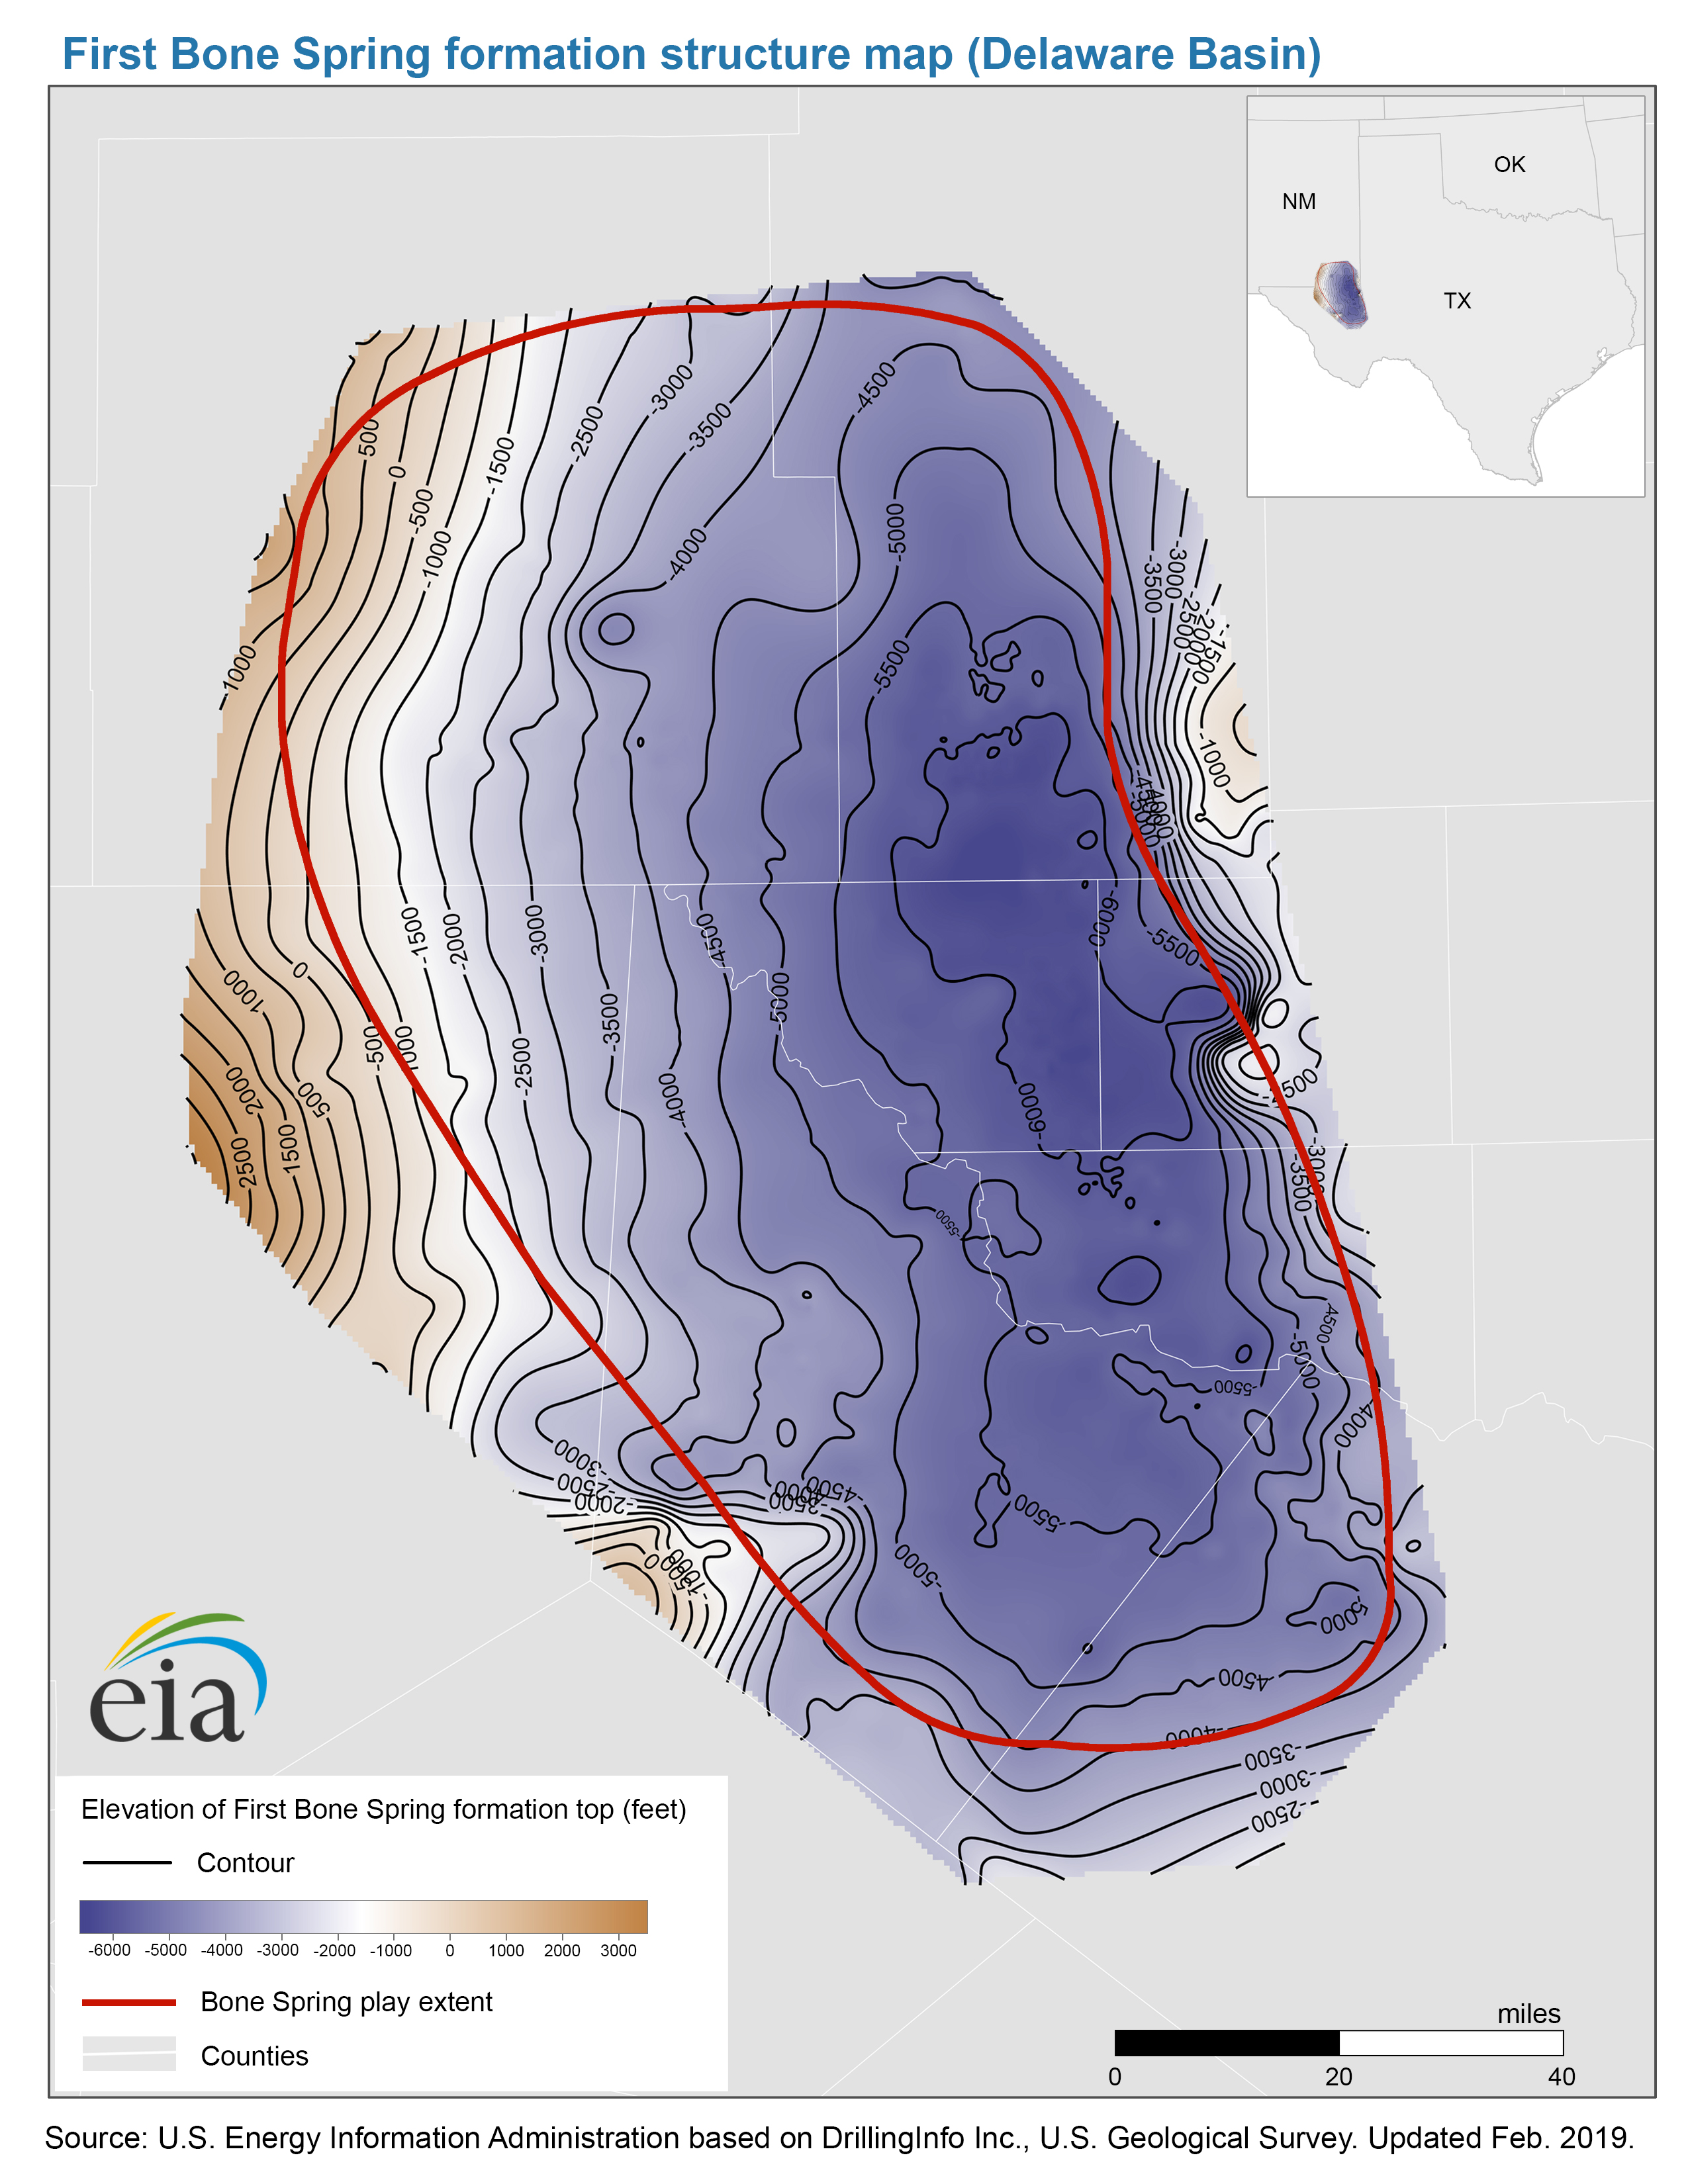
- Structure map of the First Bone Spring formation, Delaware Basin (3/4/2019) PDF JPG
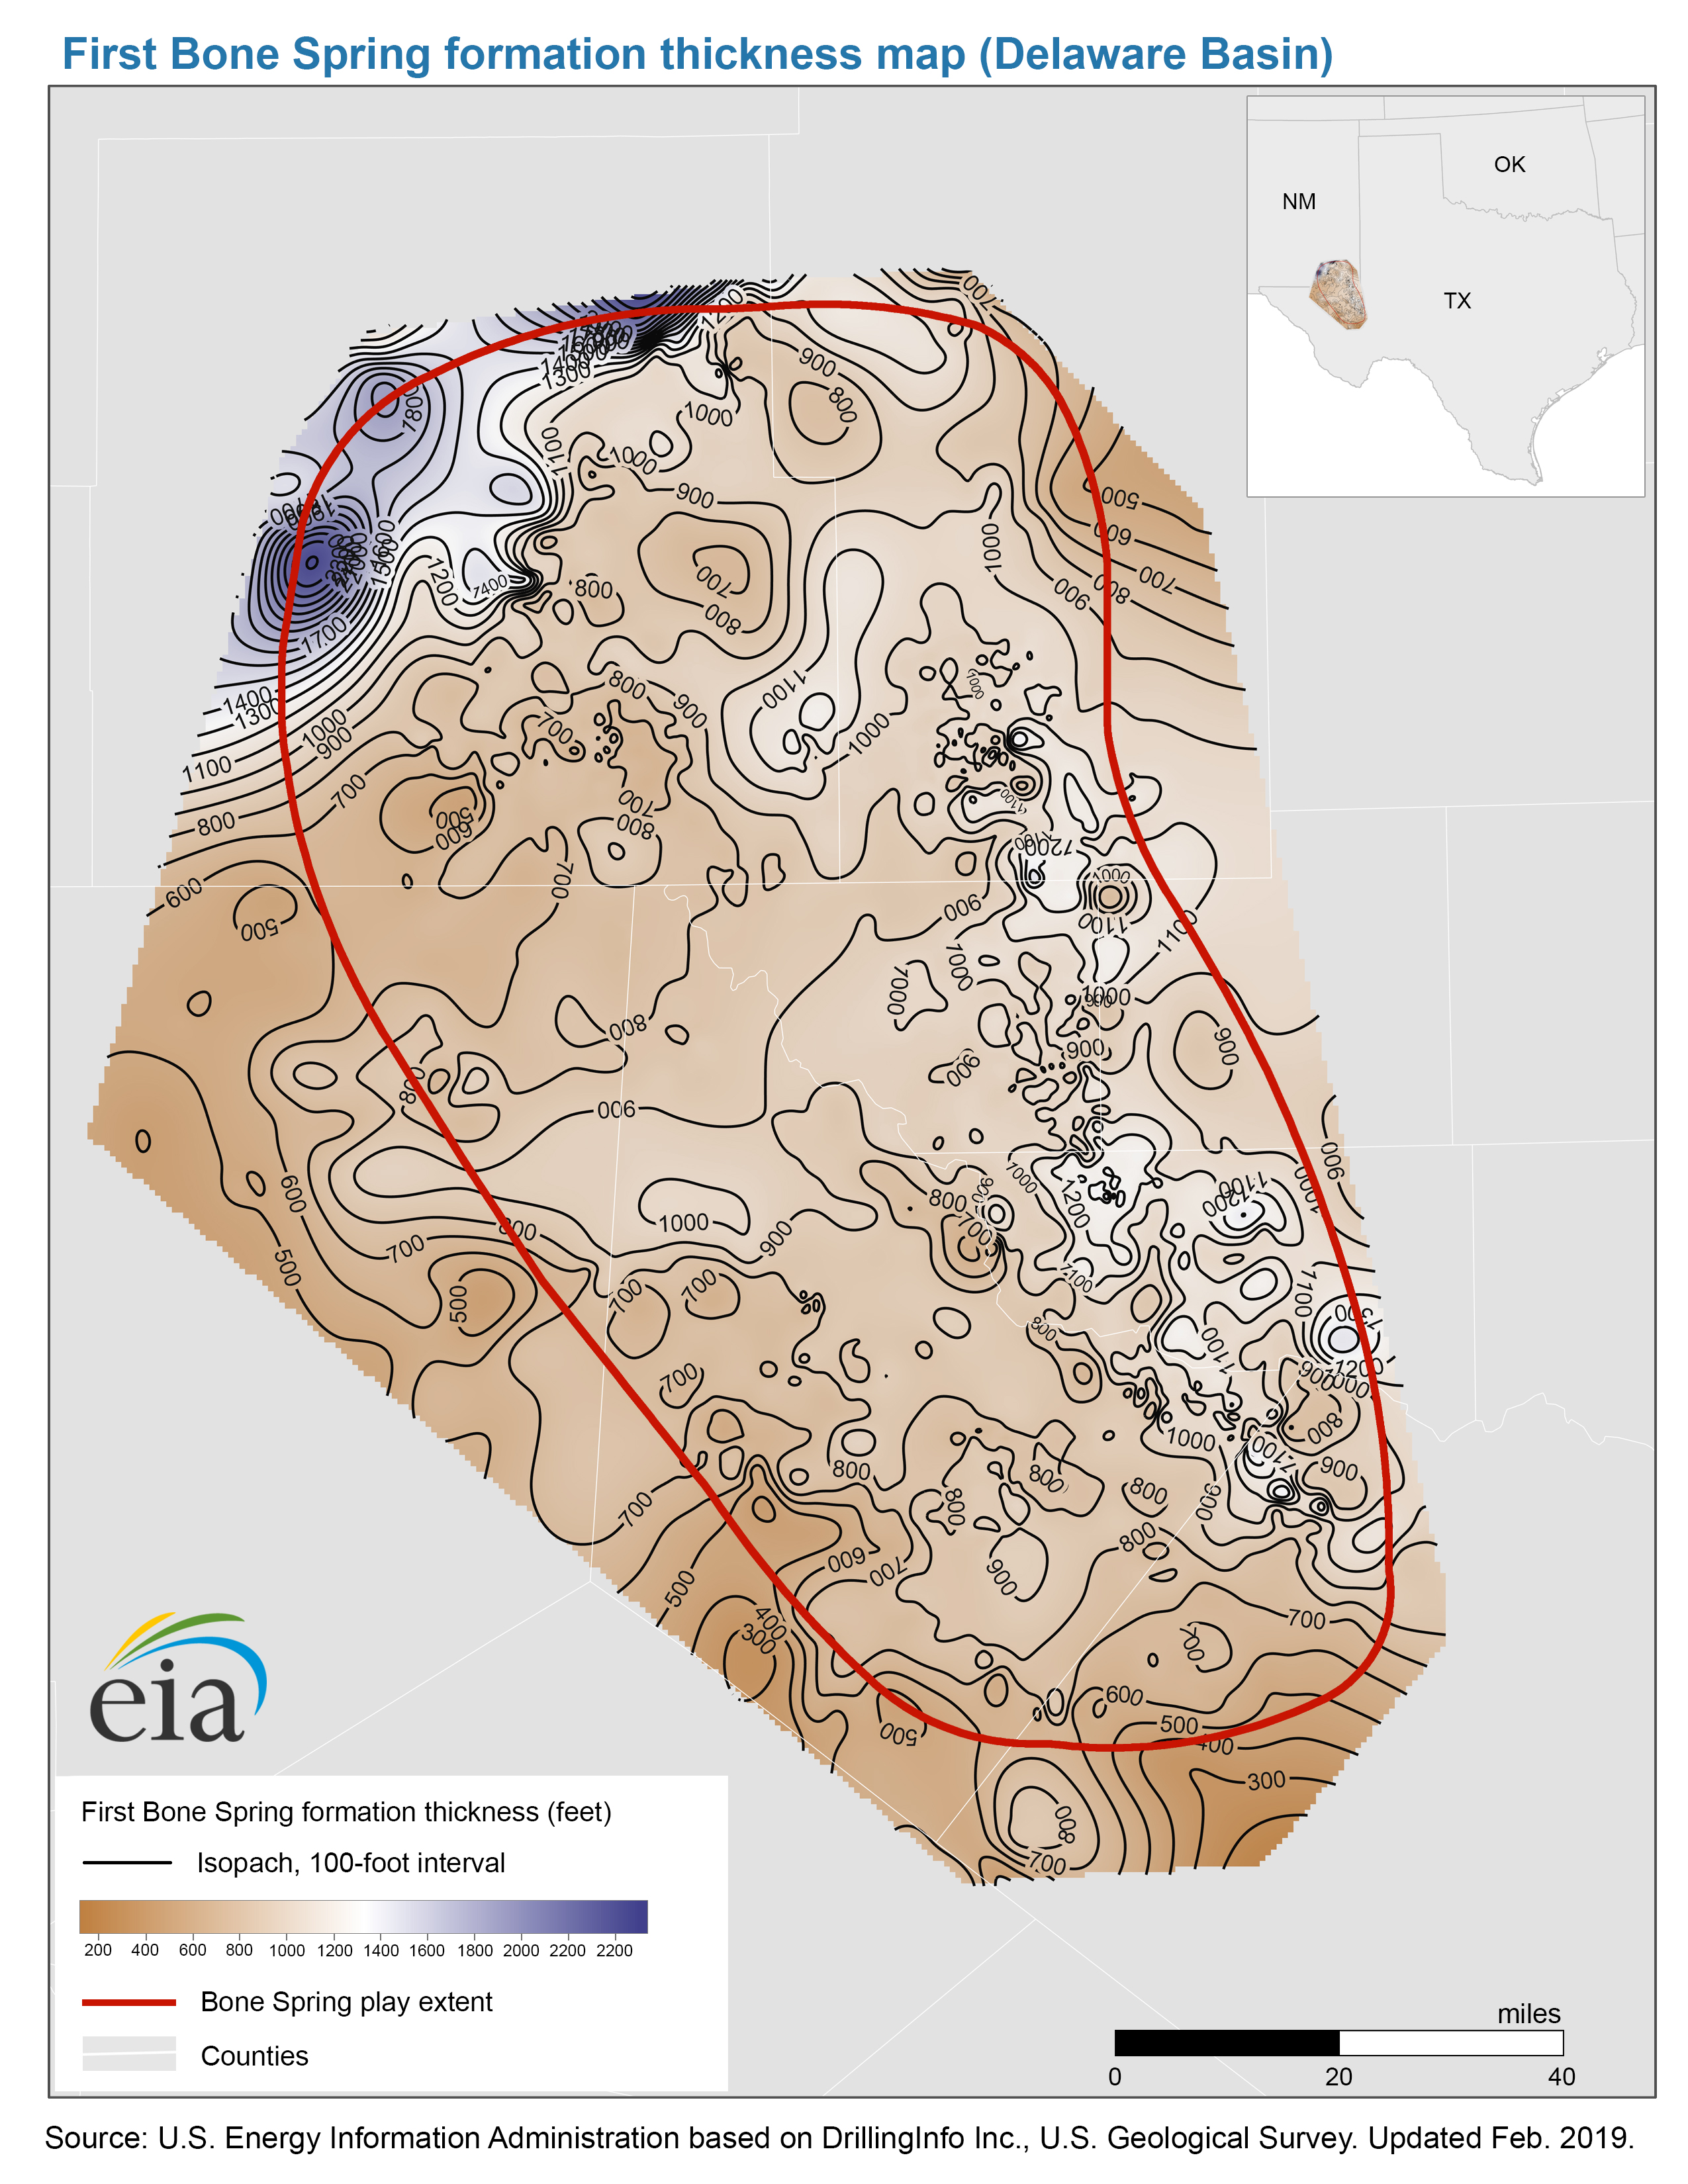
- Thickness map of the First Bone Spring formation, Delaware Basin (3/4/2019) PDF JPG
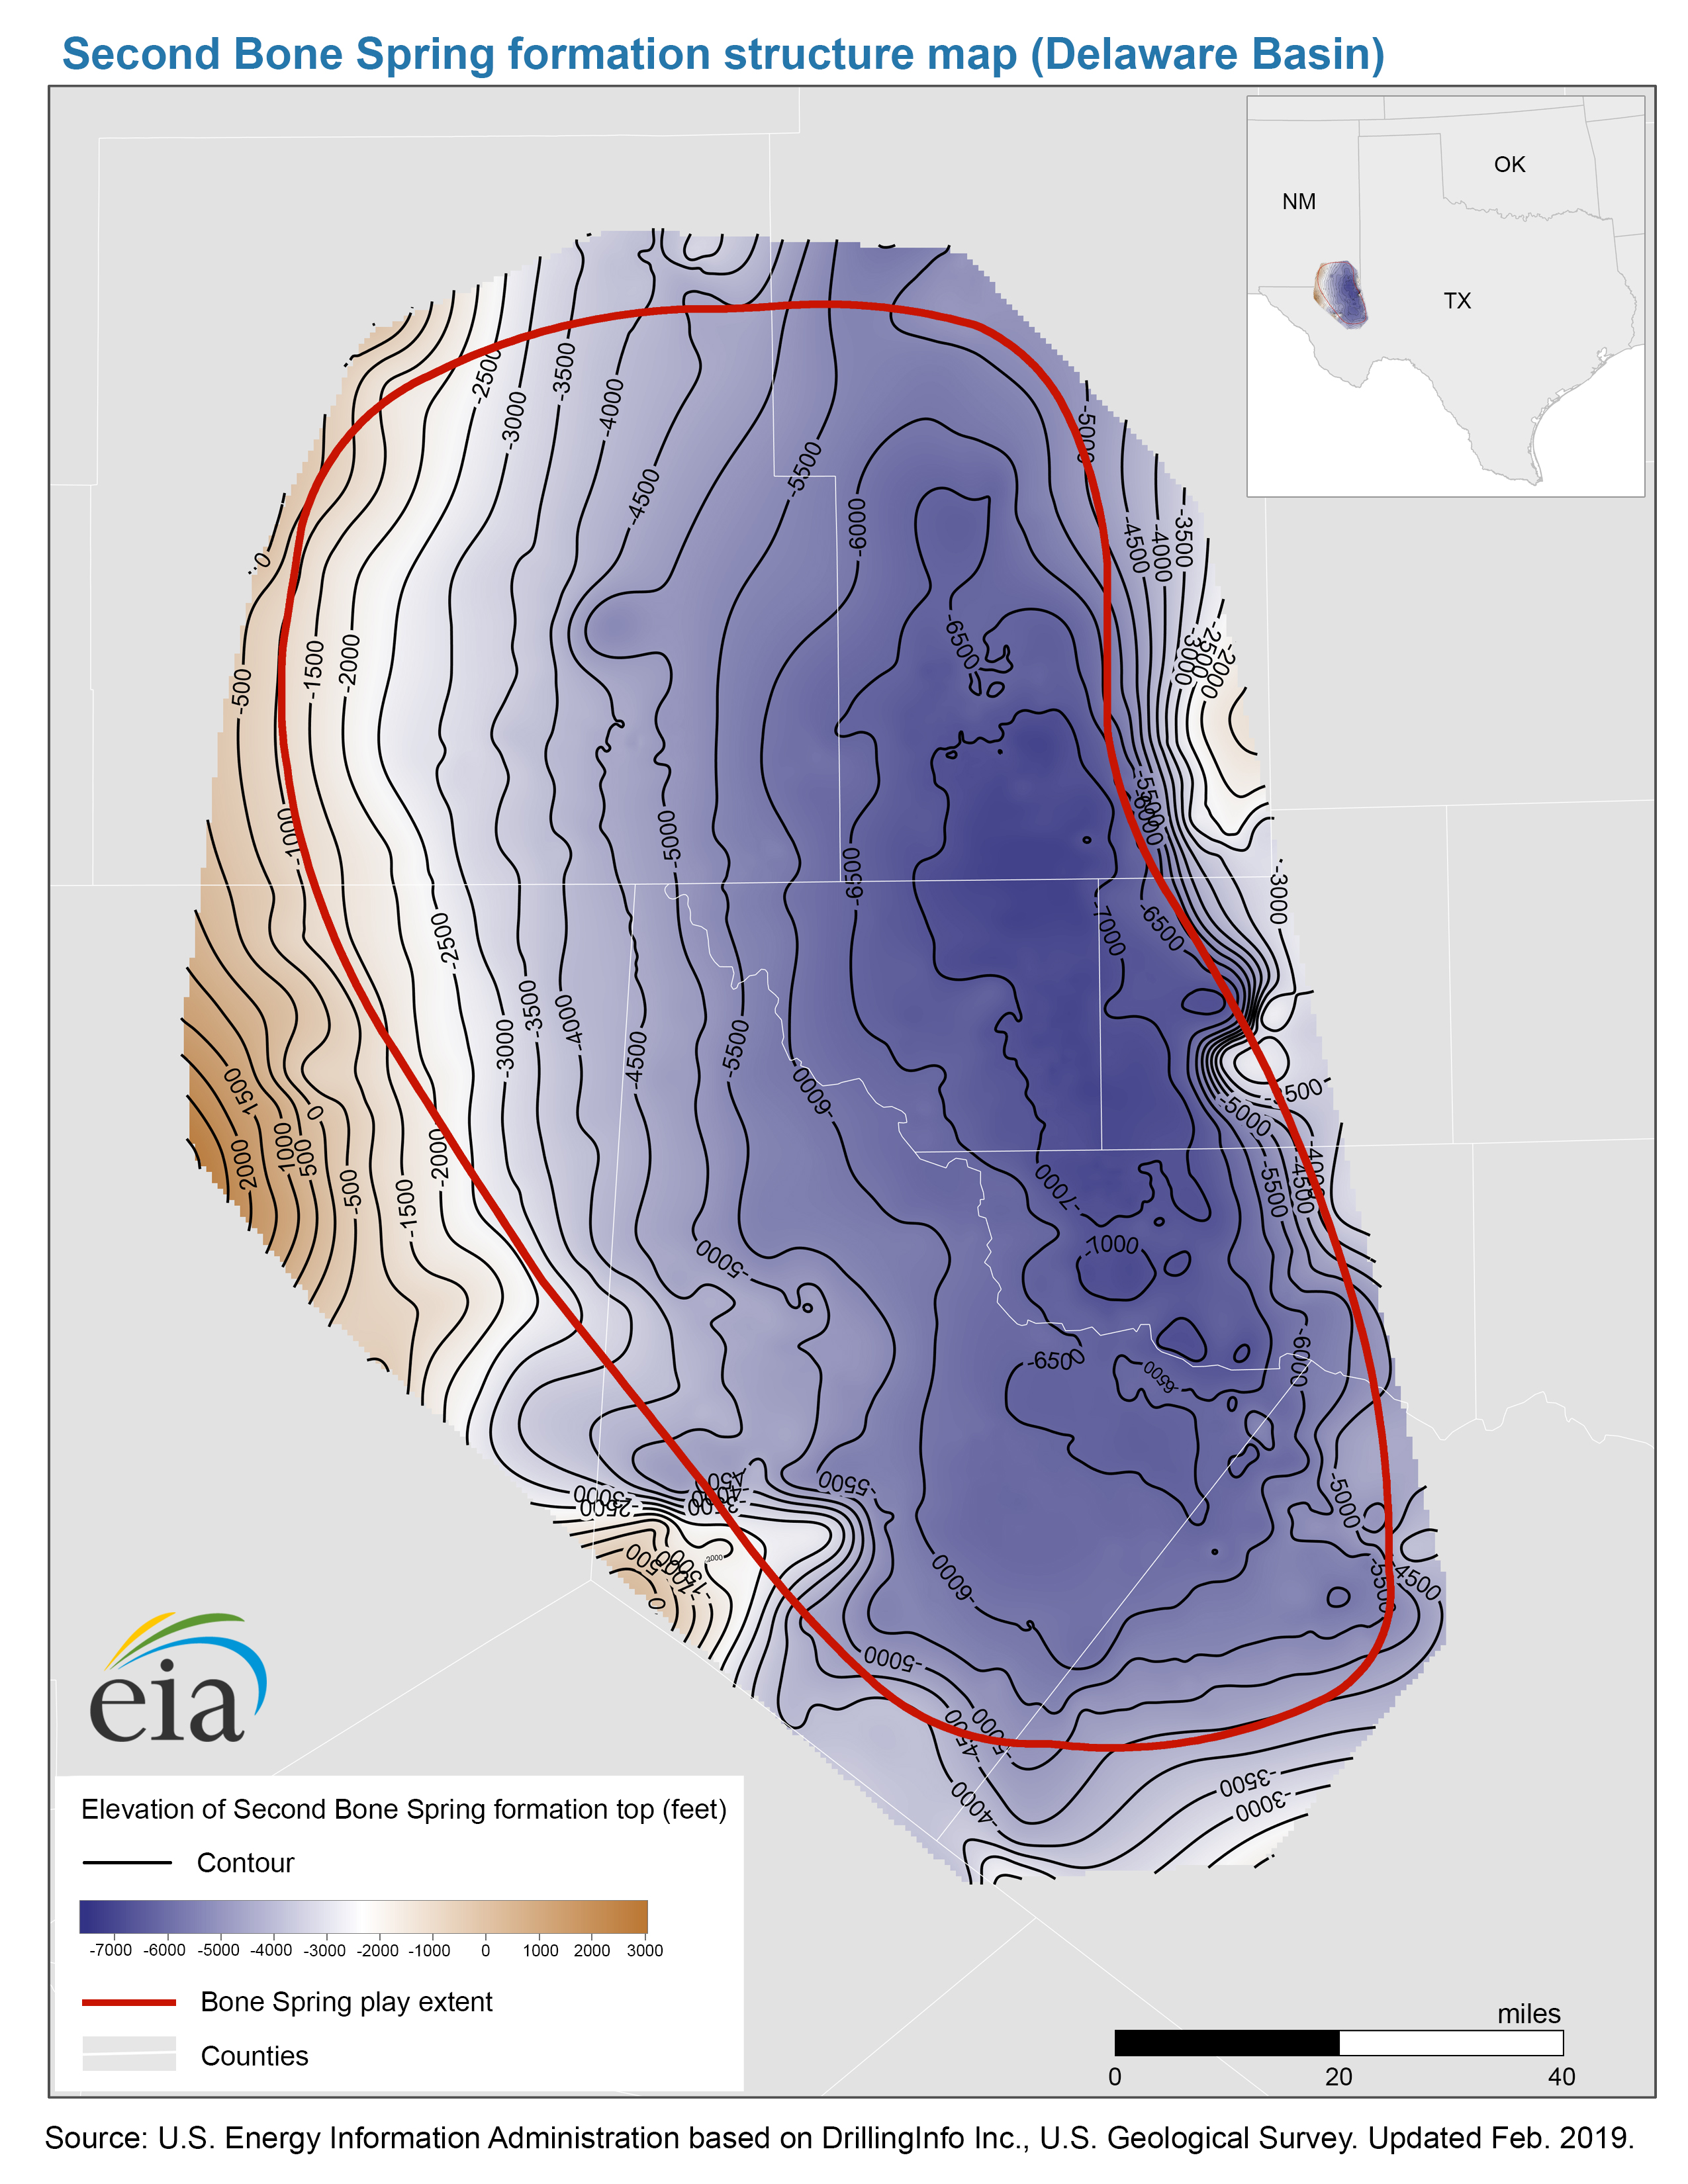
- Structure map of the Second Bone Spring formation, Delaware Basin (3/4/2019) PDF JPG
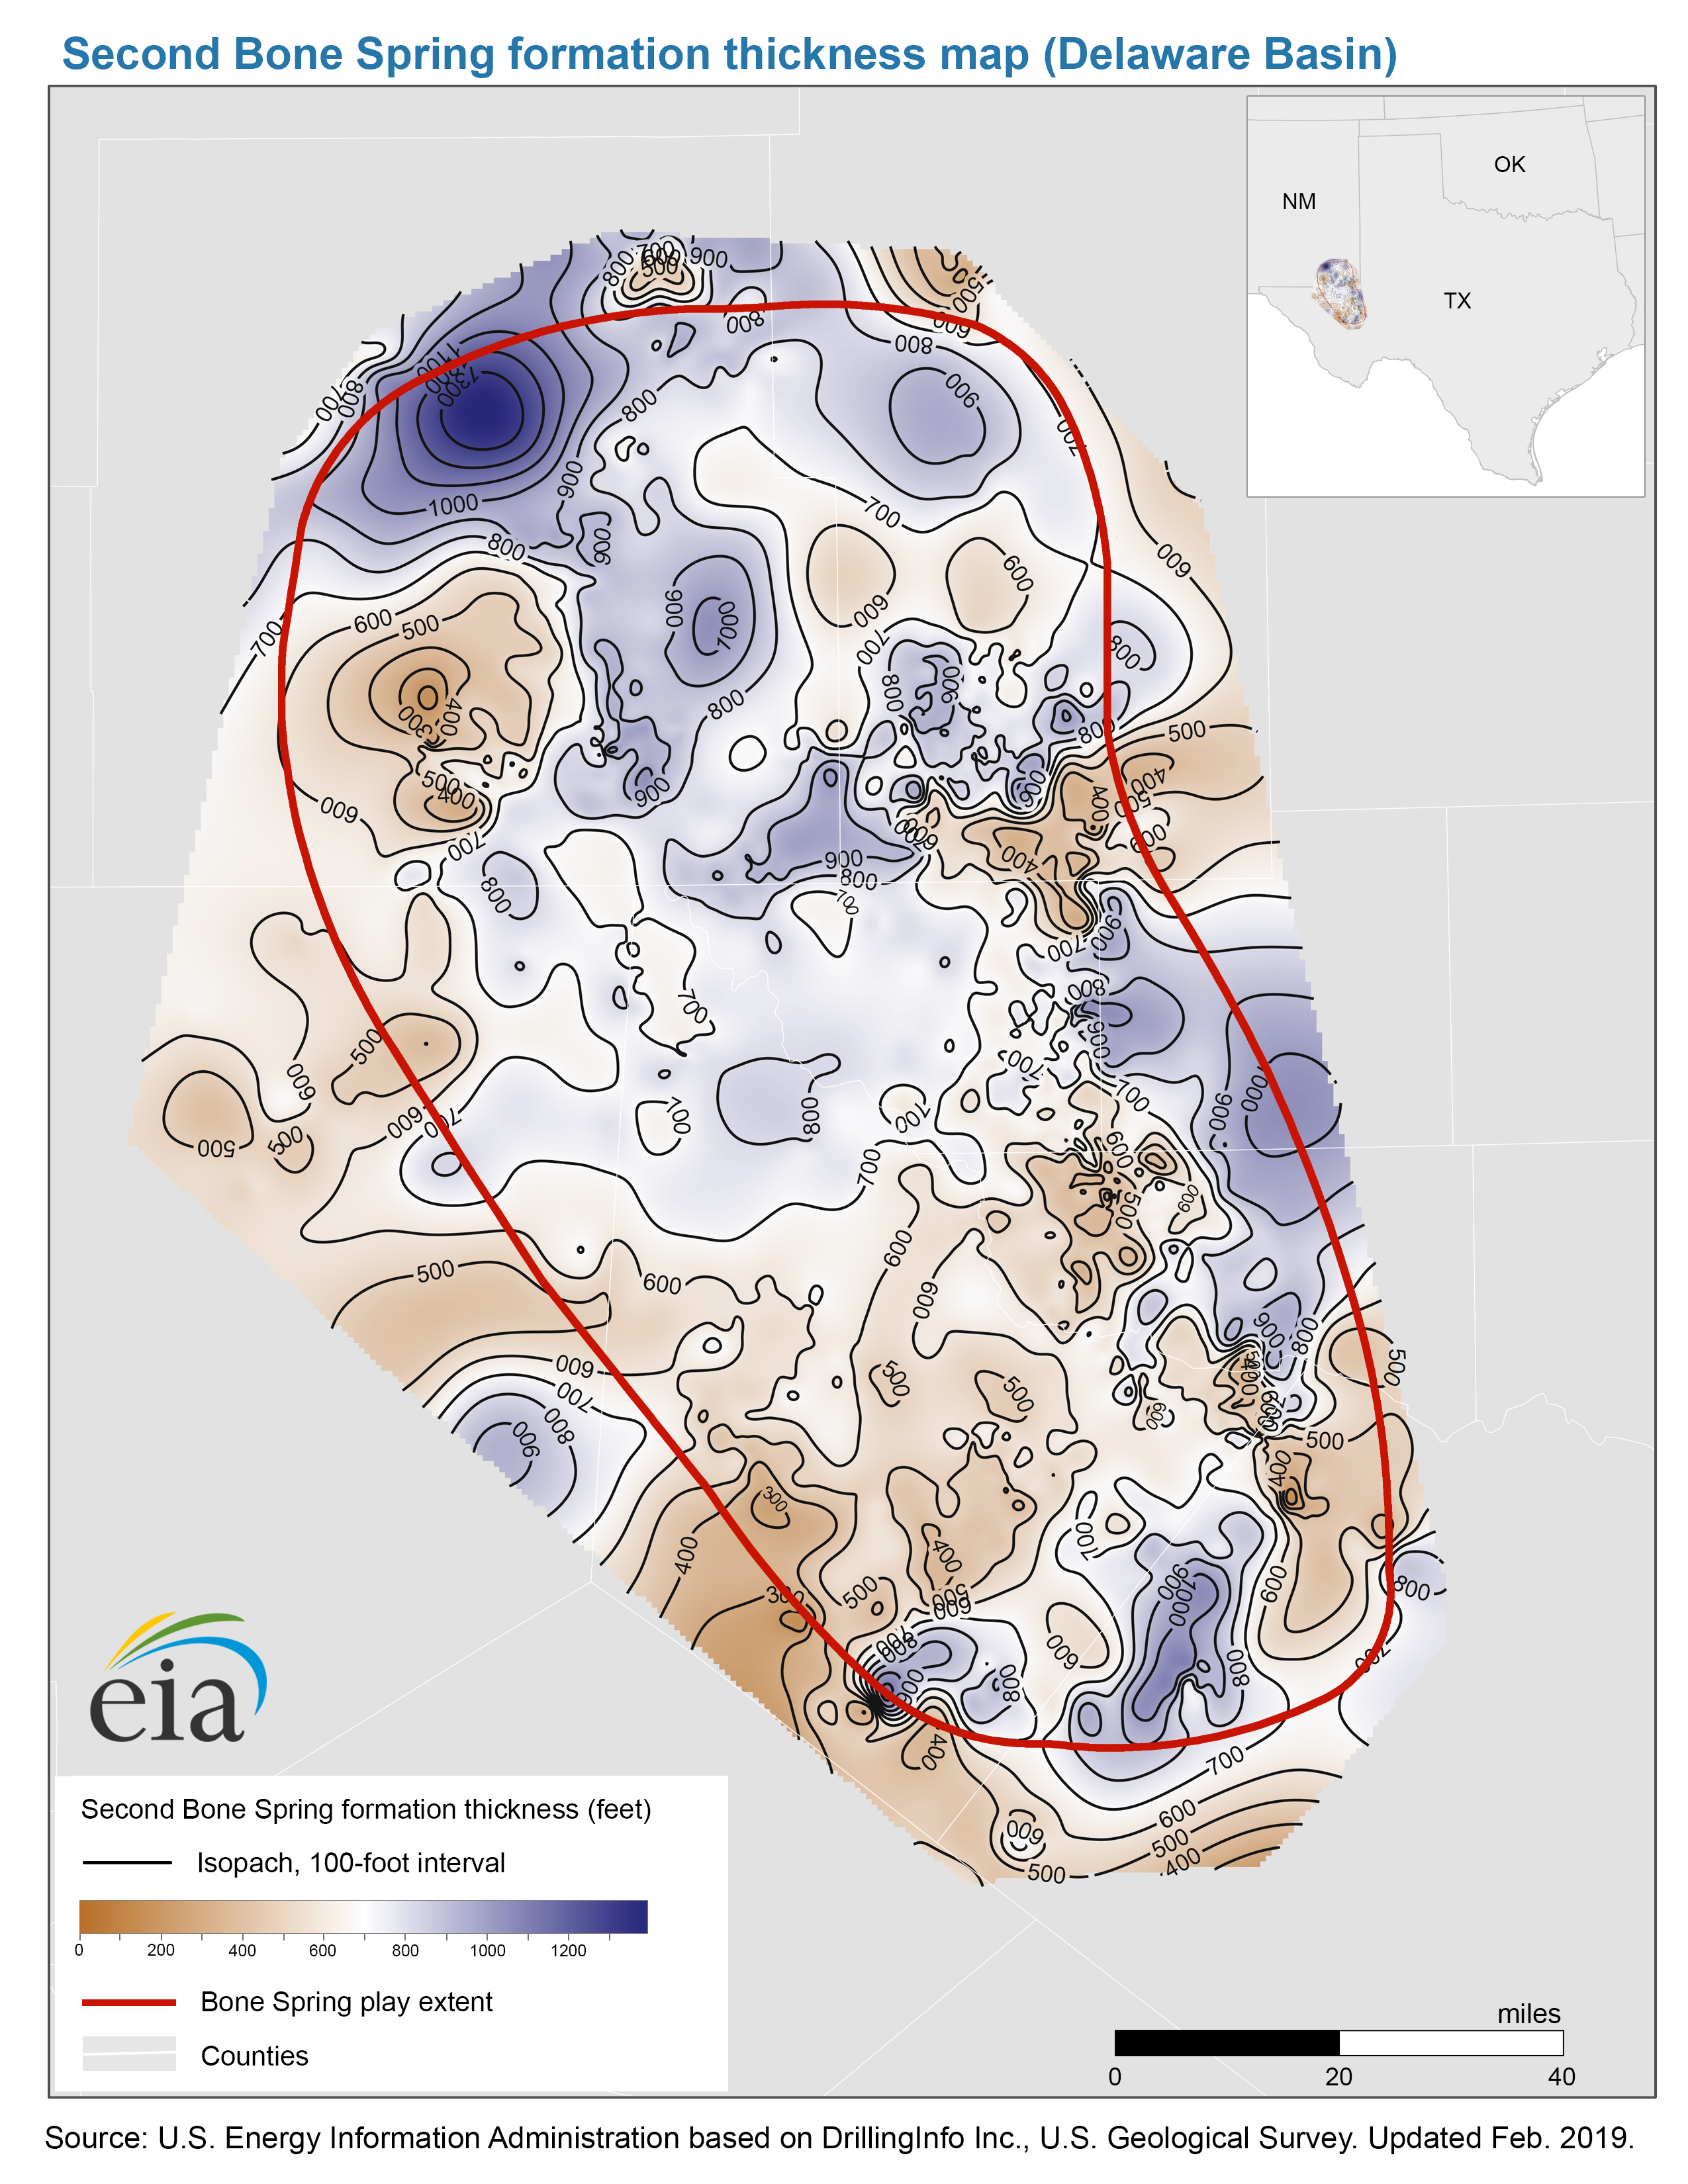
- Thickness map of the Second Bone Spring formation, Delaware Basin (3/4/2019) PDF JPG
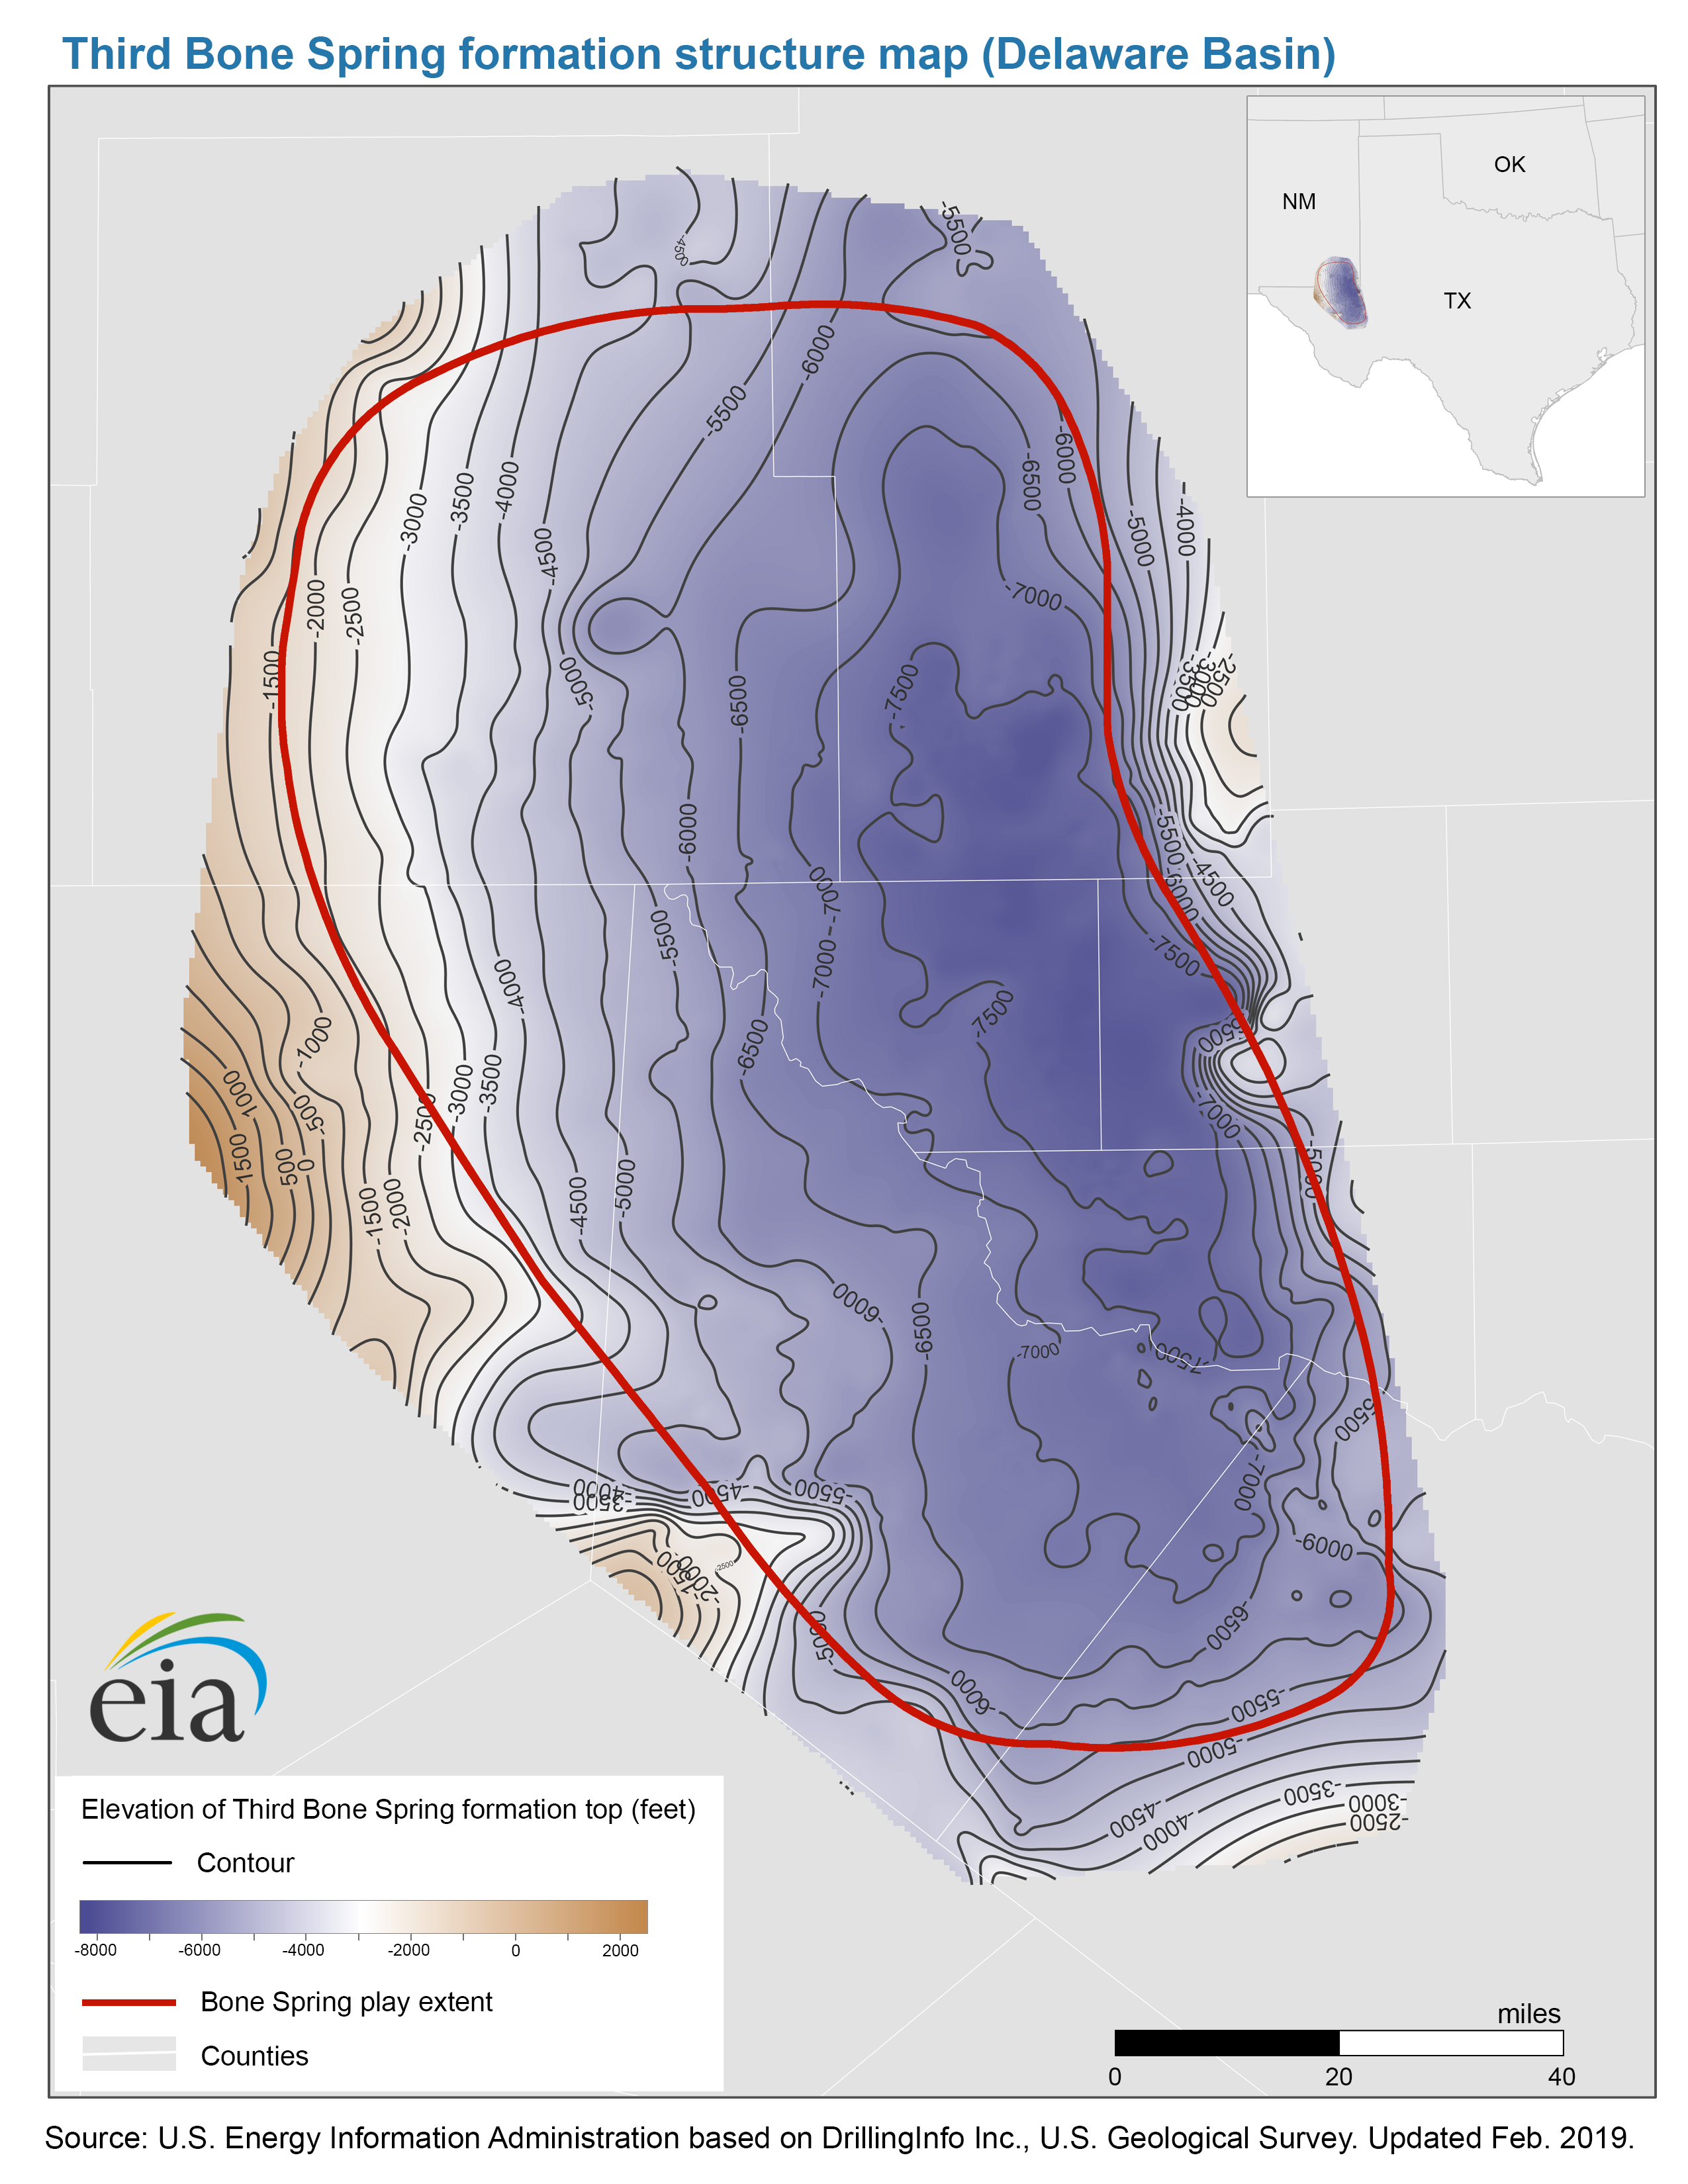
- Structure map of the Third Bone Spring formation, Delaware Basin (3/4/2019) PDF JPG
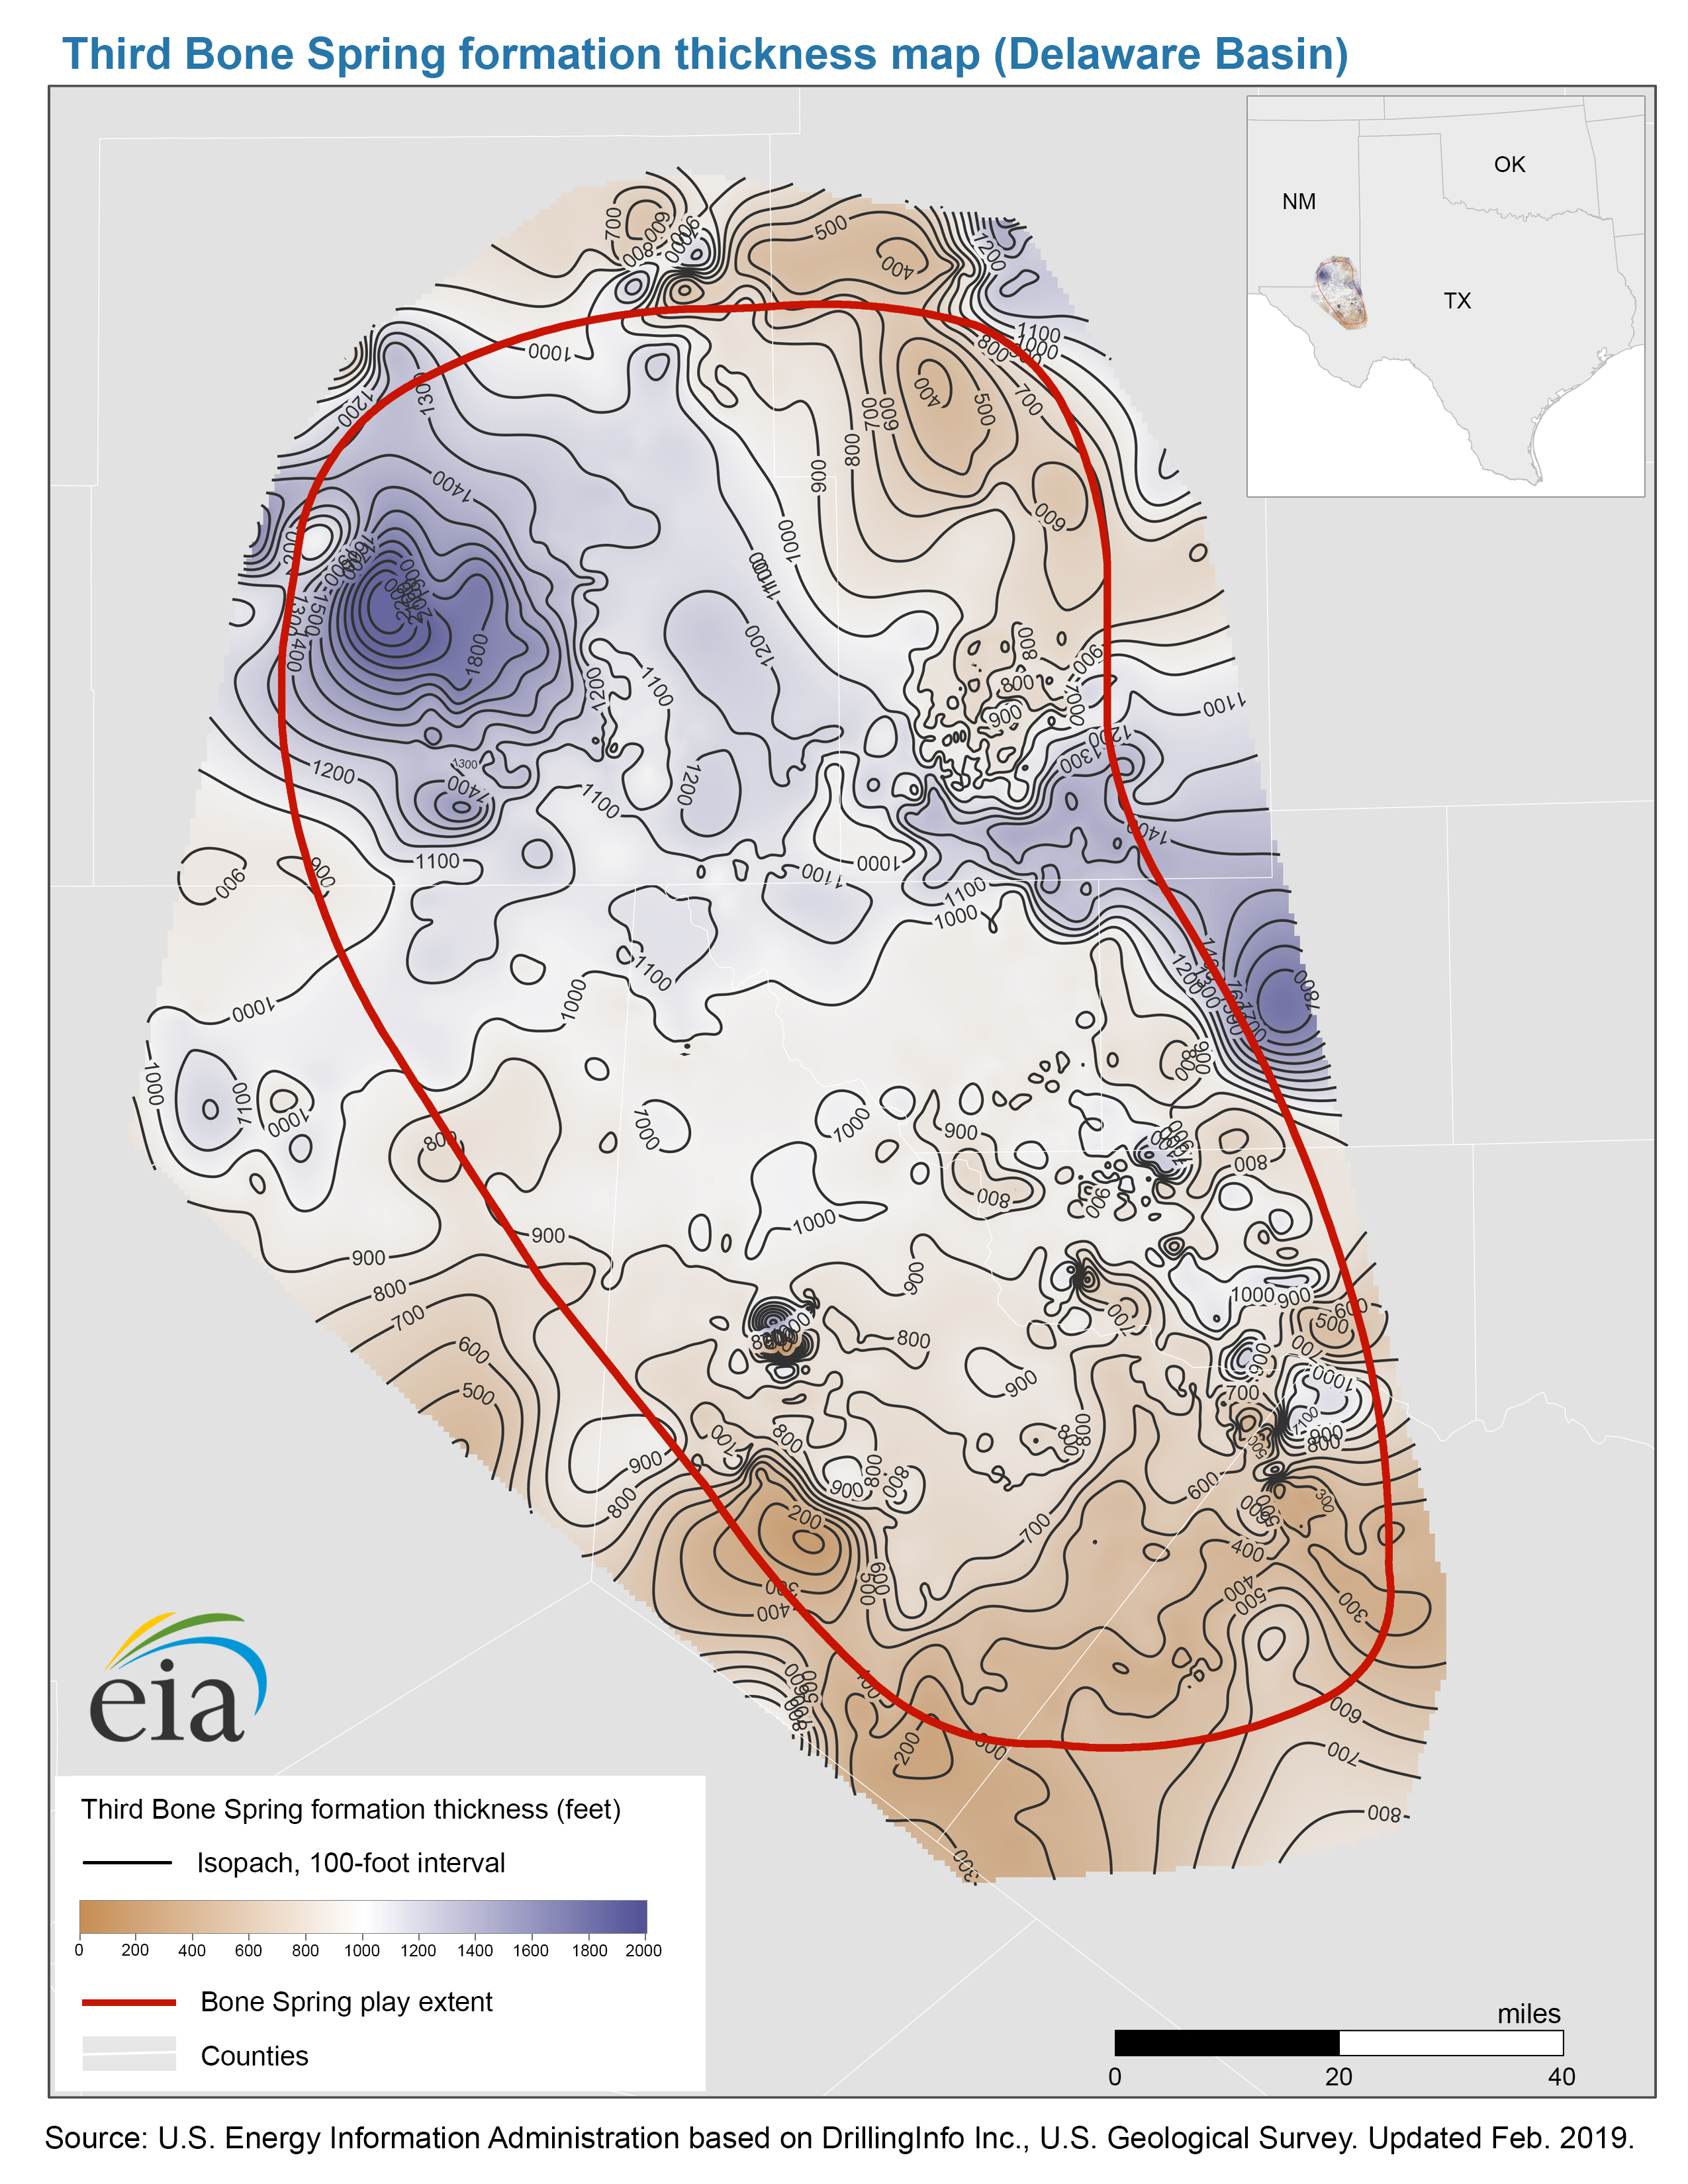
- Thickness map of the Third Bone Spring formation, Delaware Basin (3/4/2019) PDF JPG
Map data
- Bone Spring formation benches structure and isopachs (3/26/2019) Shapefile
- Bone Spring and Avalon Bone Spring play extents (3/26/2019) Shapefile
Wolfcamp formation benches
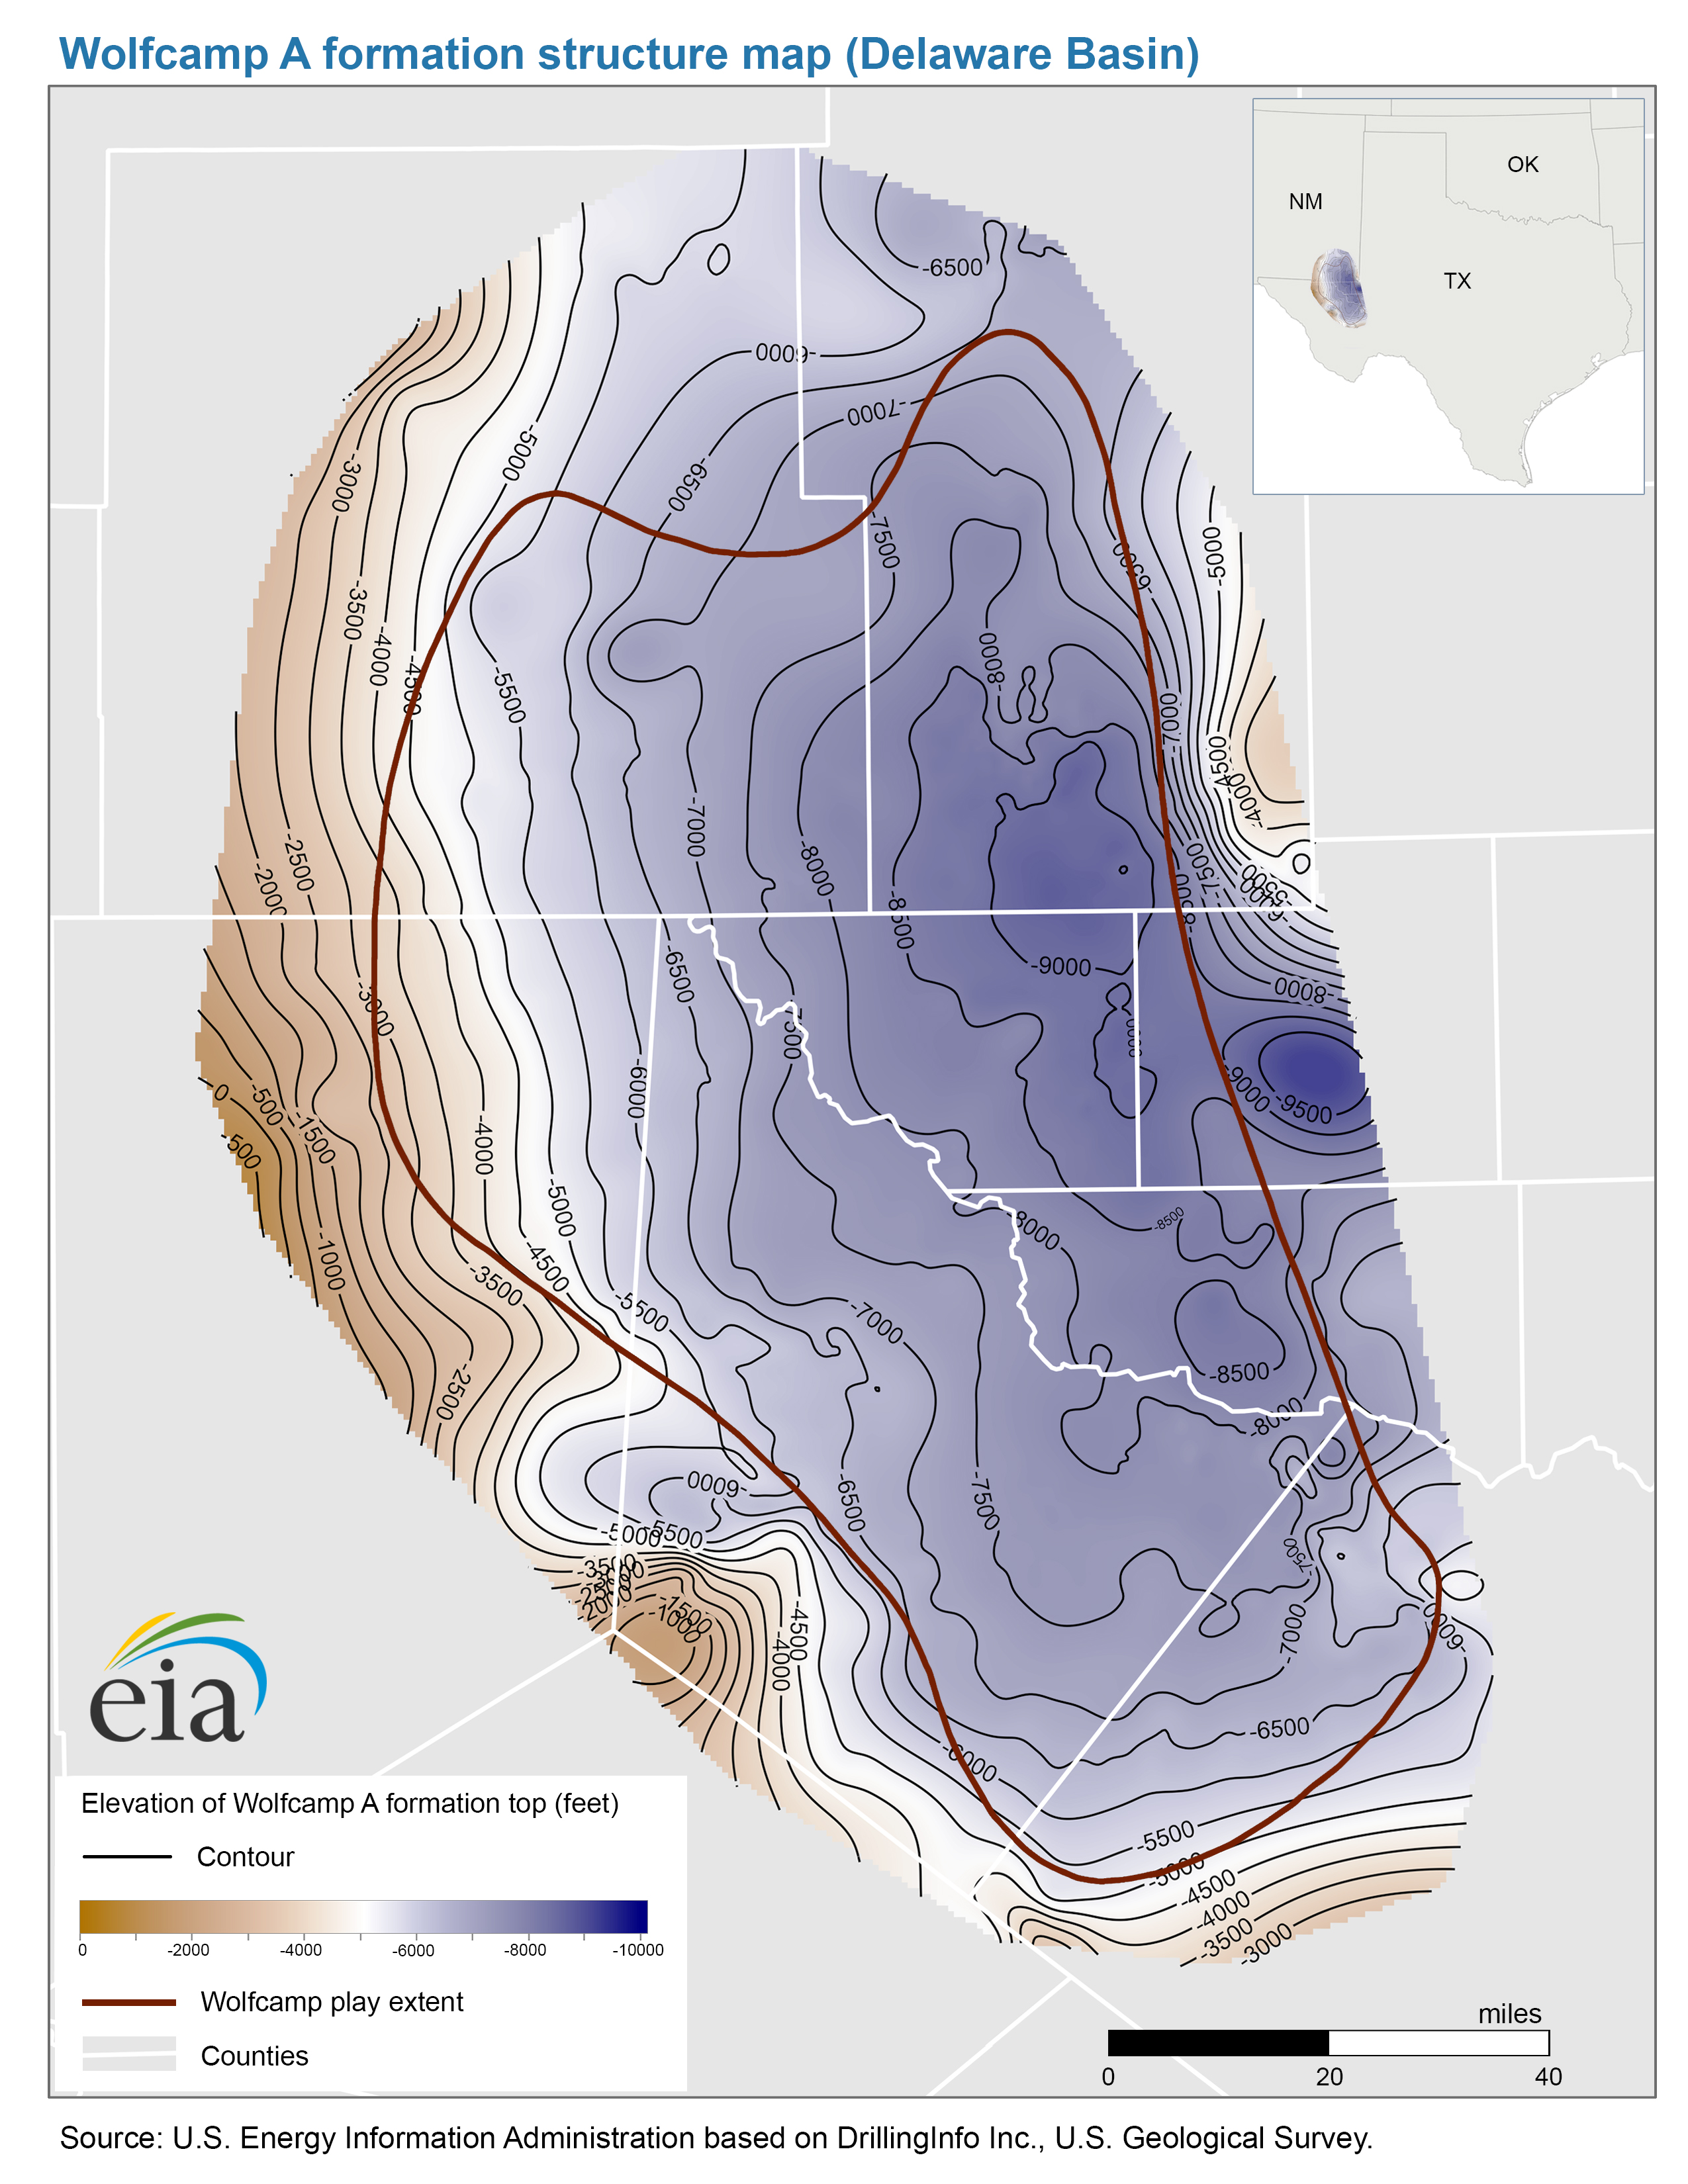
- Structure map of the Wolfcamp A formation, Delaware Basin (8/24/2018) PDF JPG
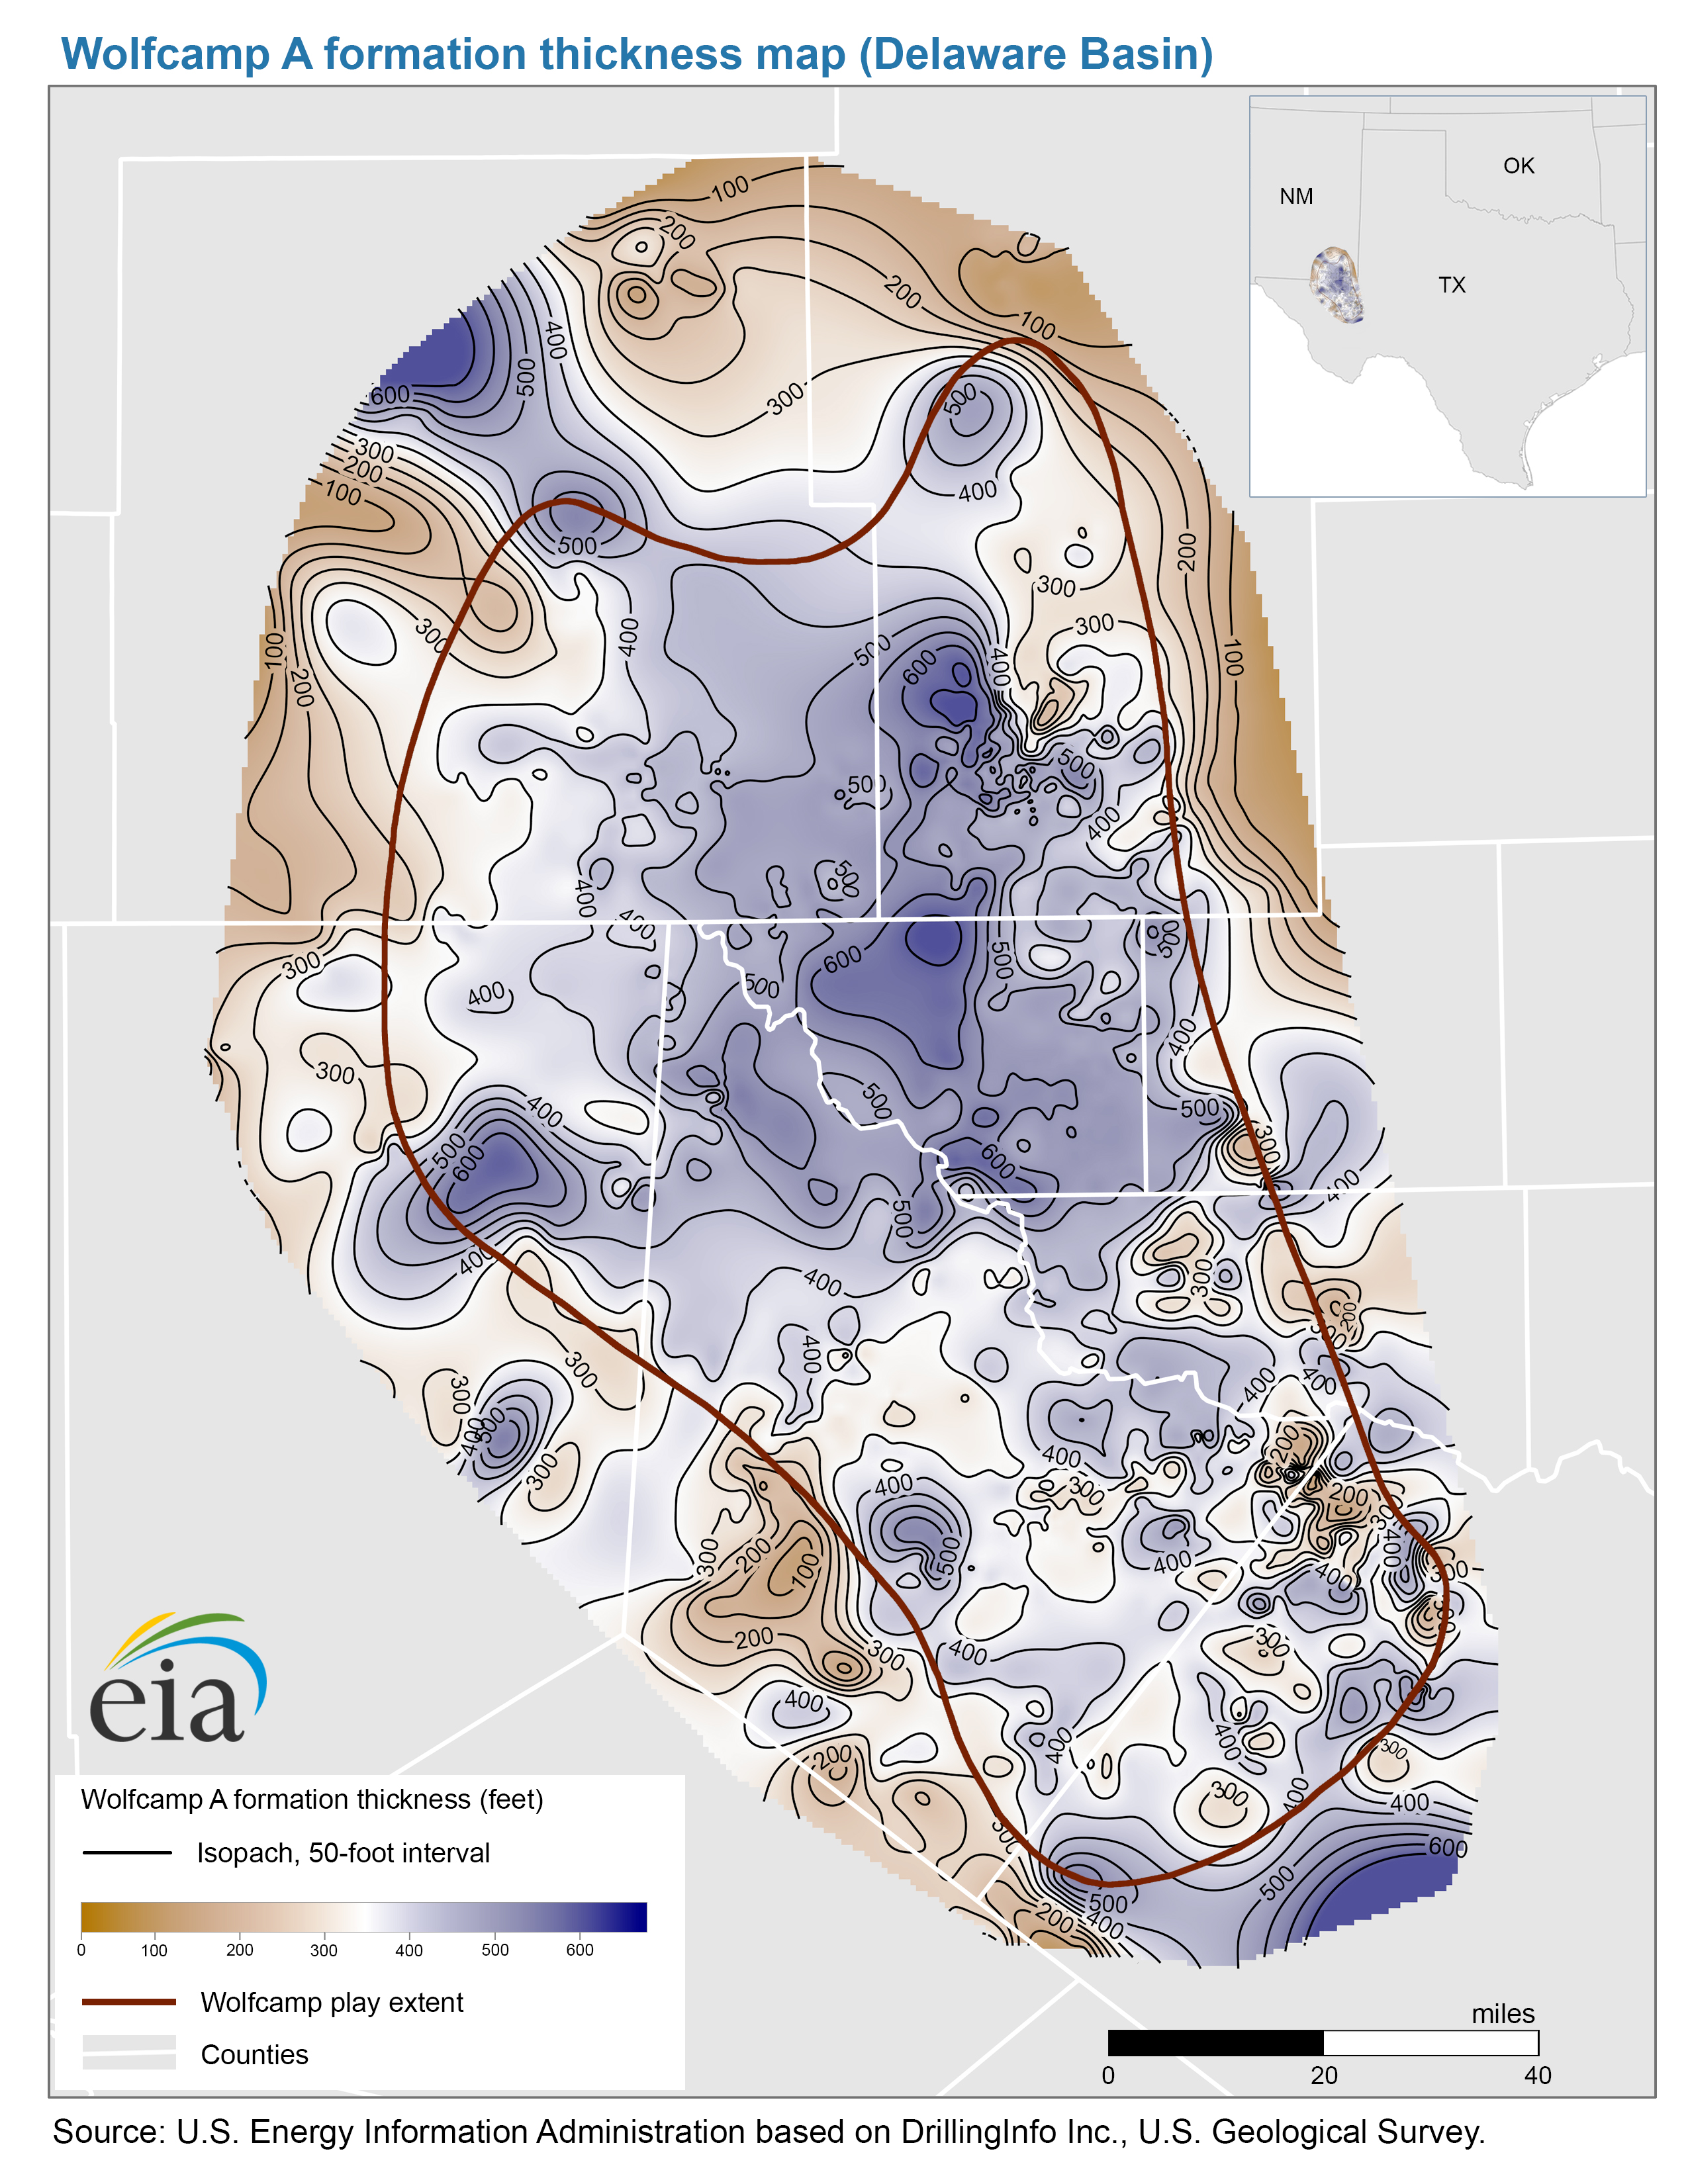
- Thickness map of the Wolfcamp A formation, Delaware Basin (8/24/2018) PDF JPG
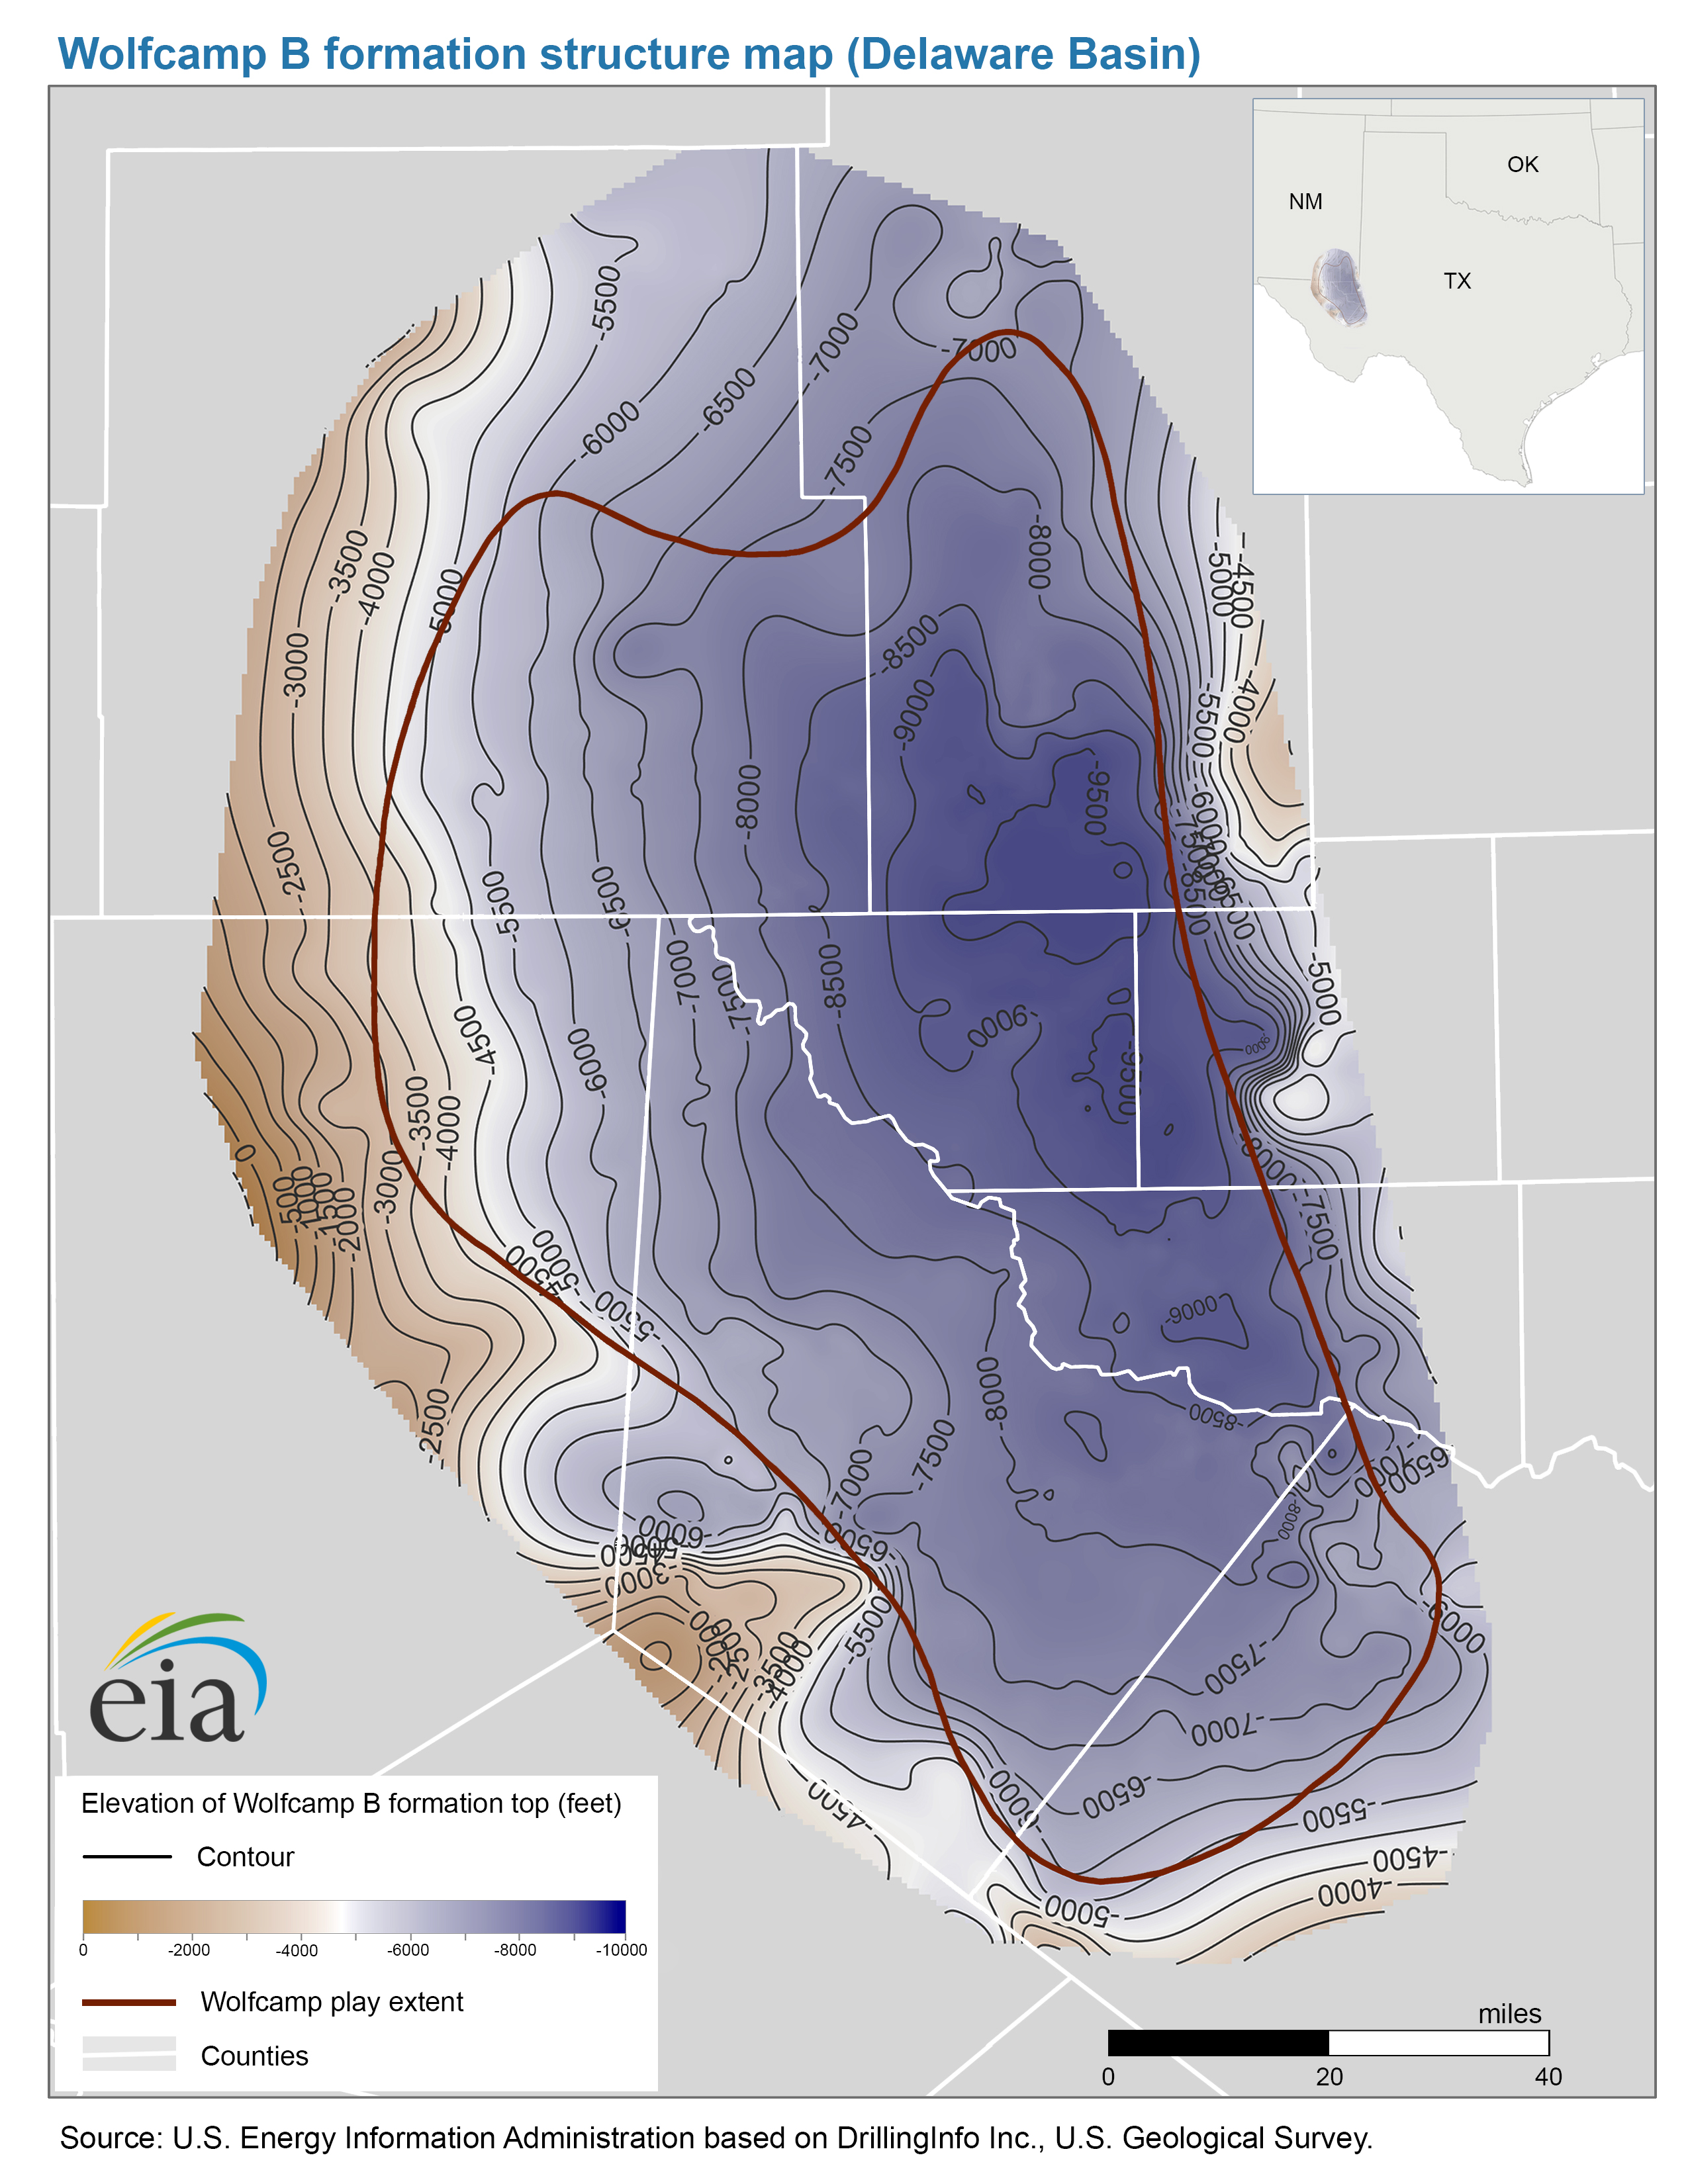
- Structure map of the Wolfcamp B formation, Delaware Basin (11/26/2018) PDF JPG
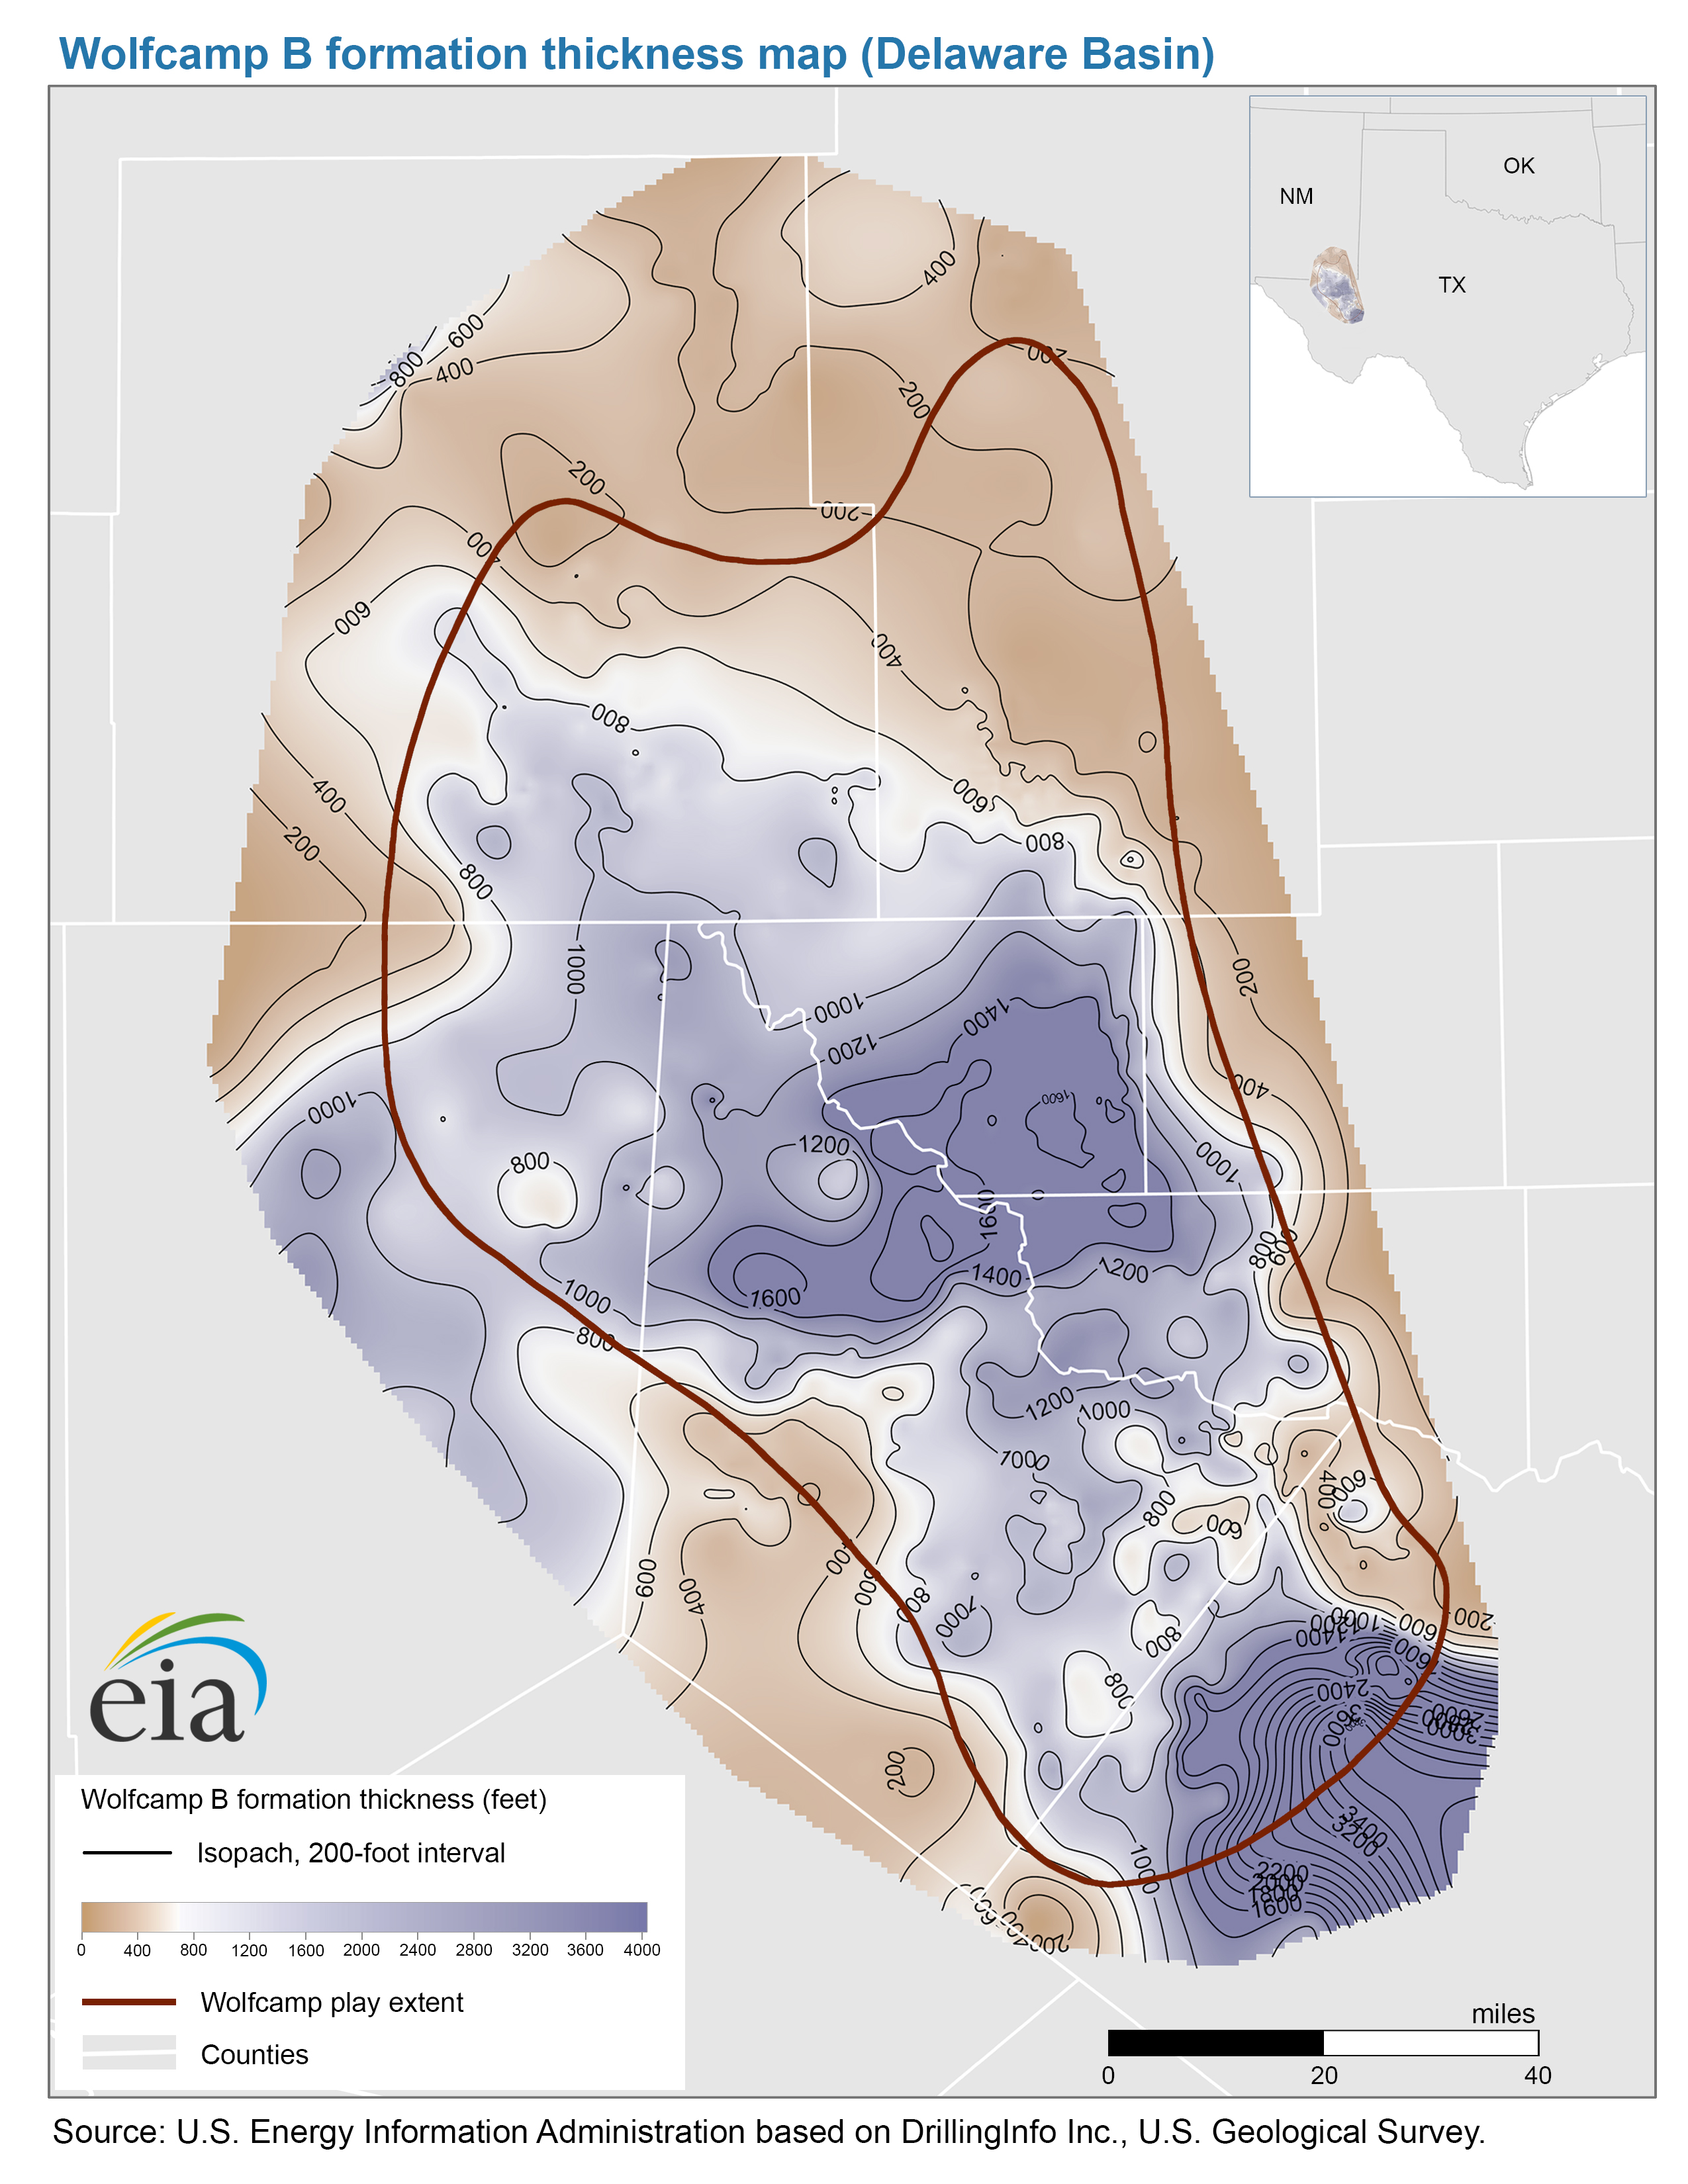
- Thickness map of the Wolfcamp B formation, Delaware Basin (11/26/2018) PDF JPG
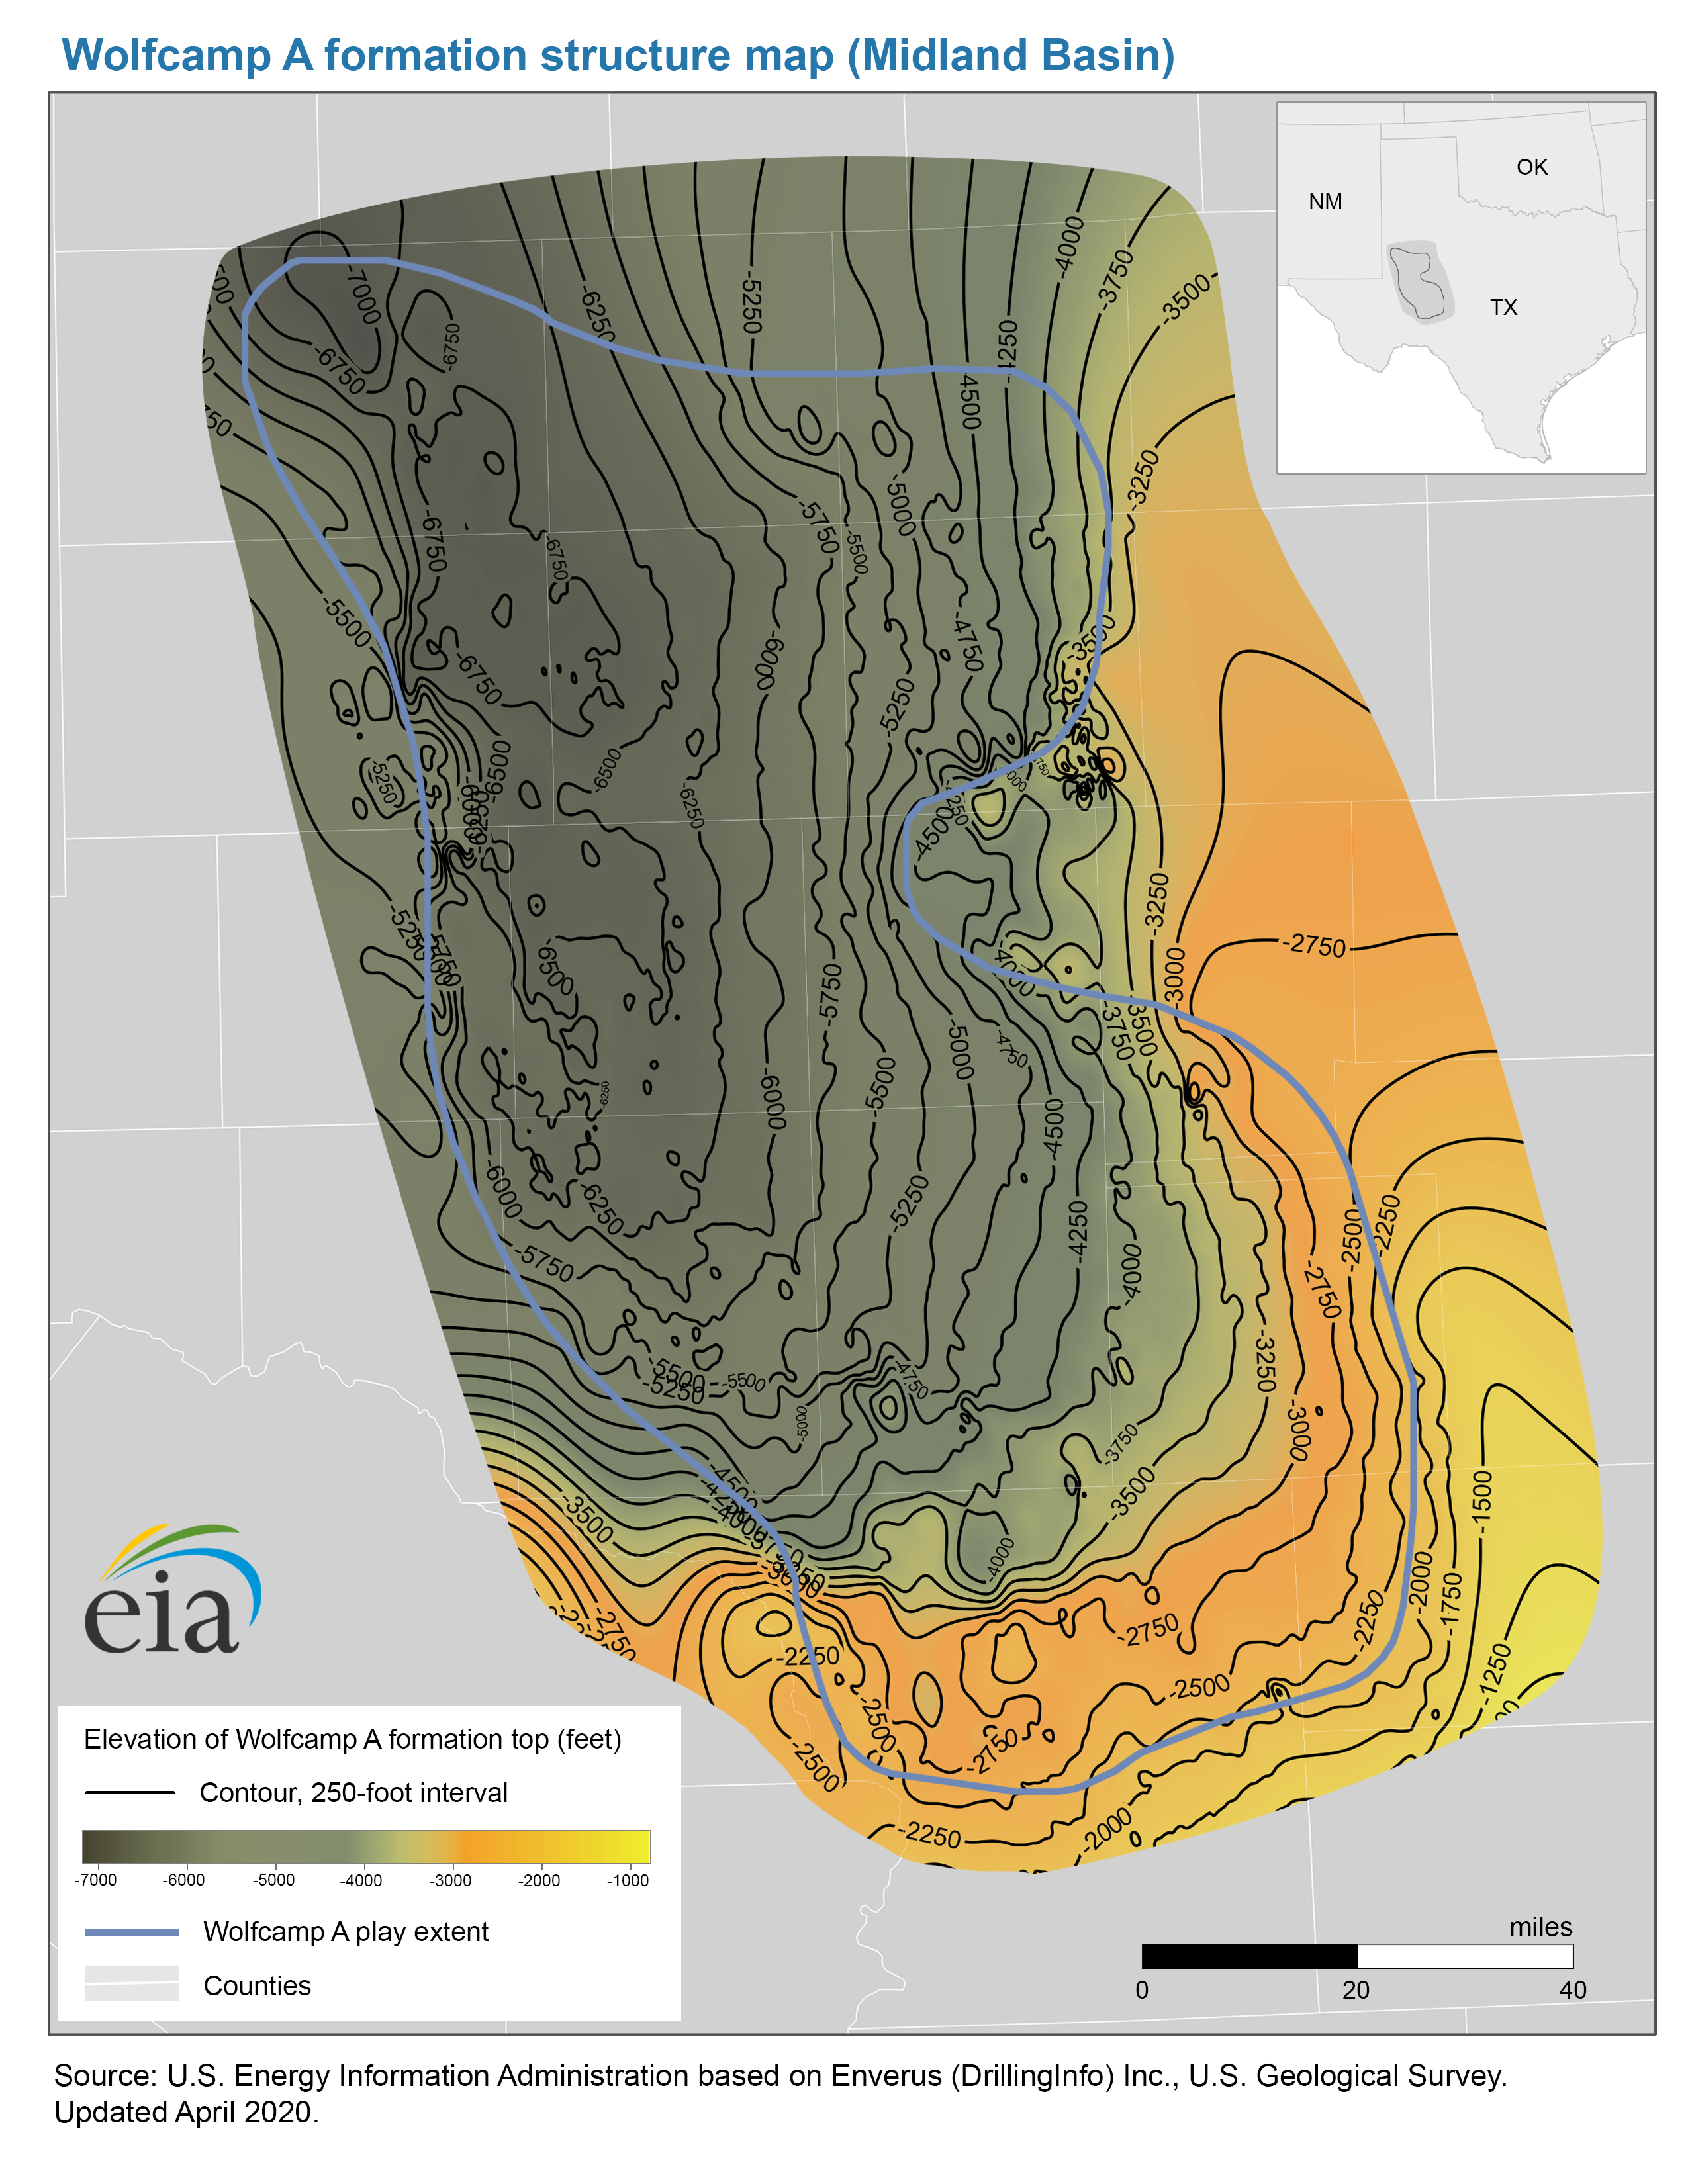
- Structure map of the Wolfcamp A formation, Midland Basin (4/23/2020) PDF JPG
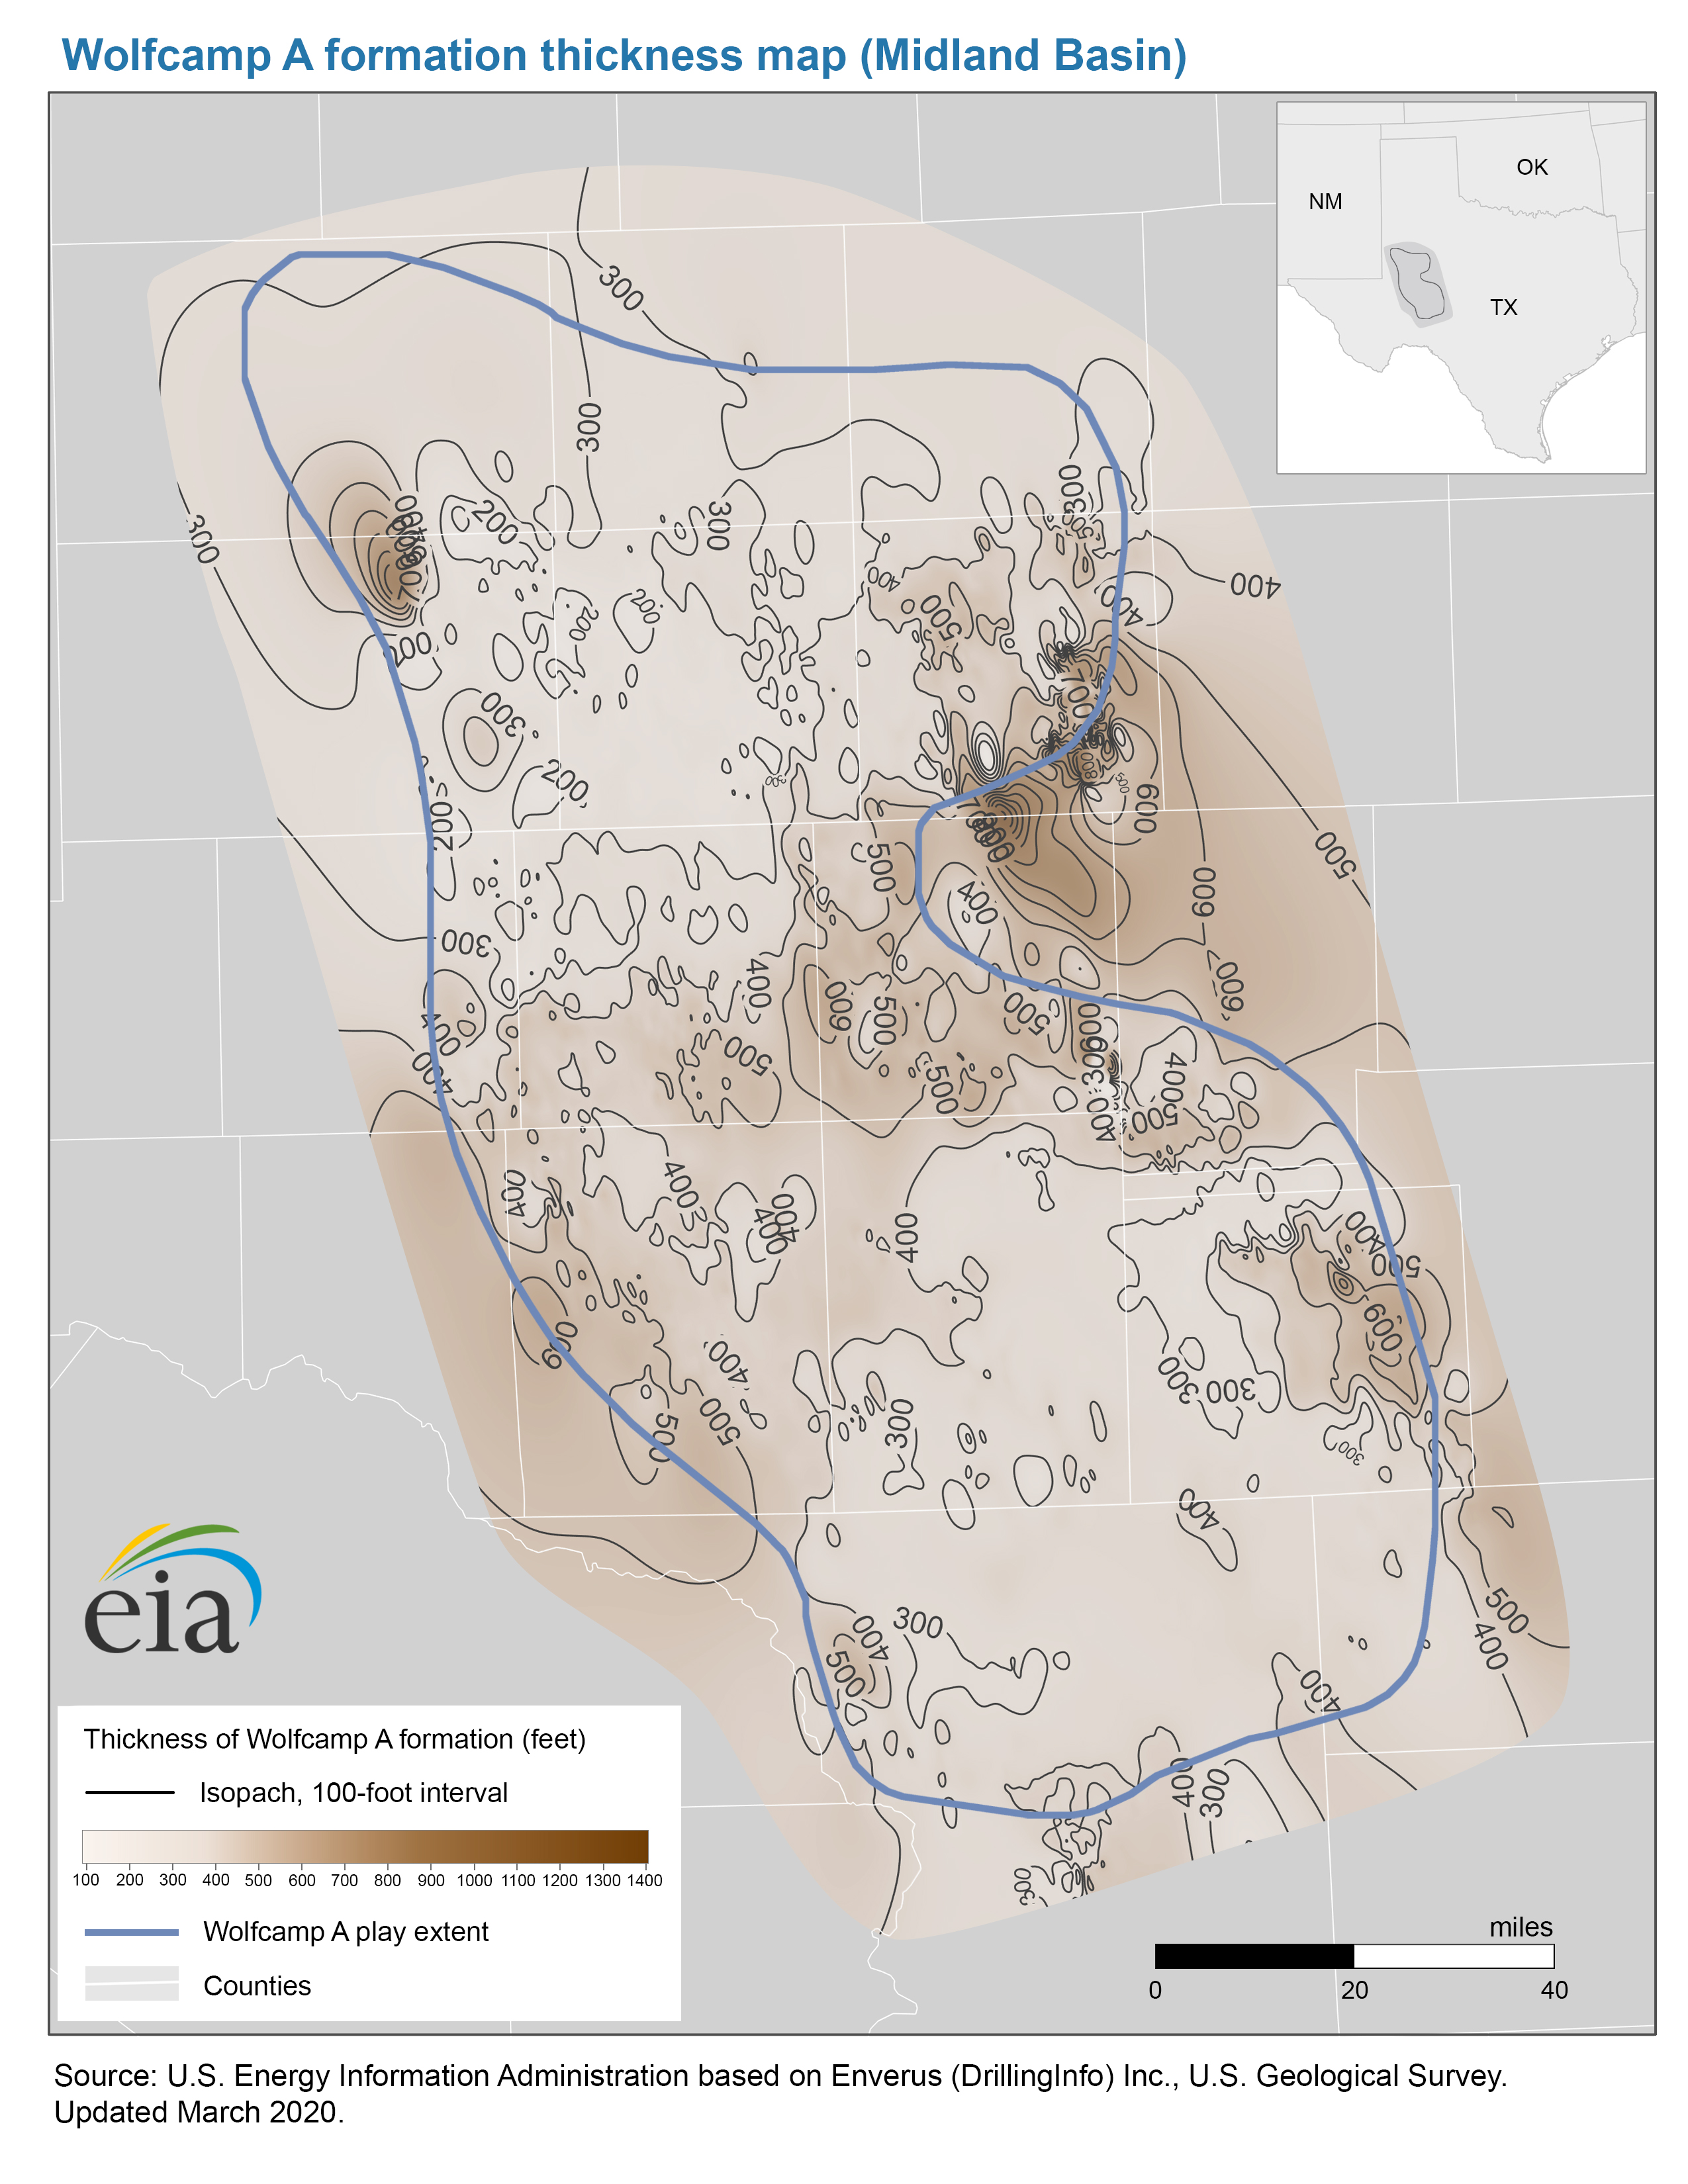
- Thickness map of the Wolfcamp A formation, Midland Basin (4/23/2020) PDF JPG
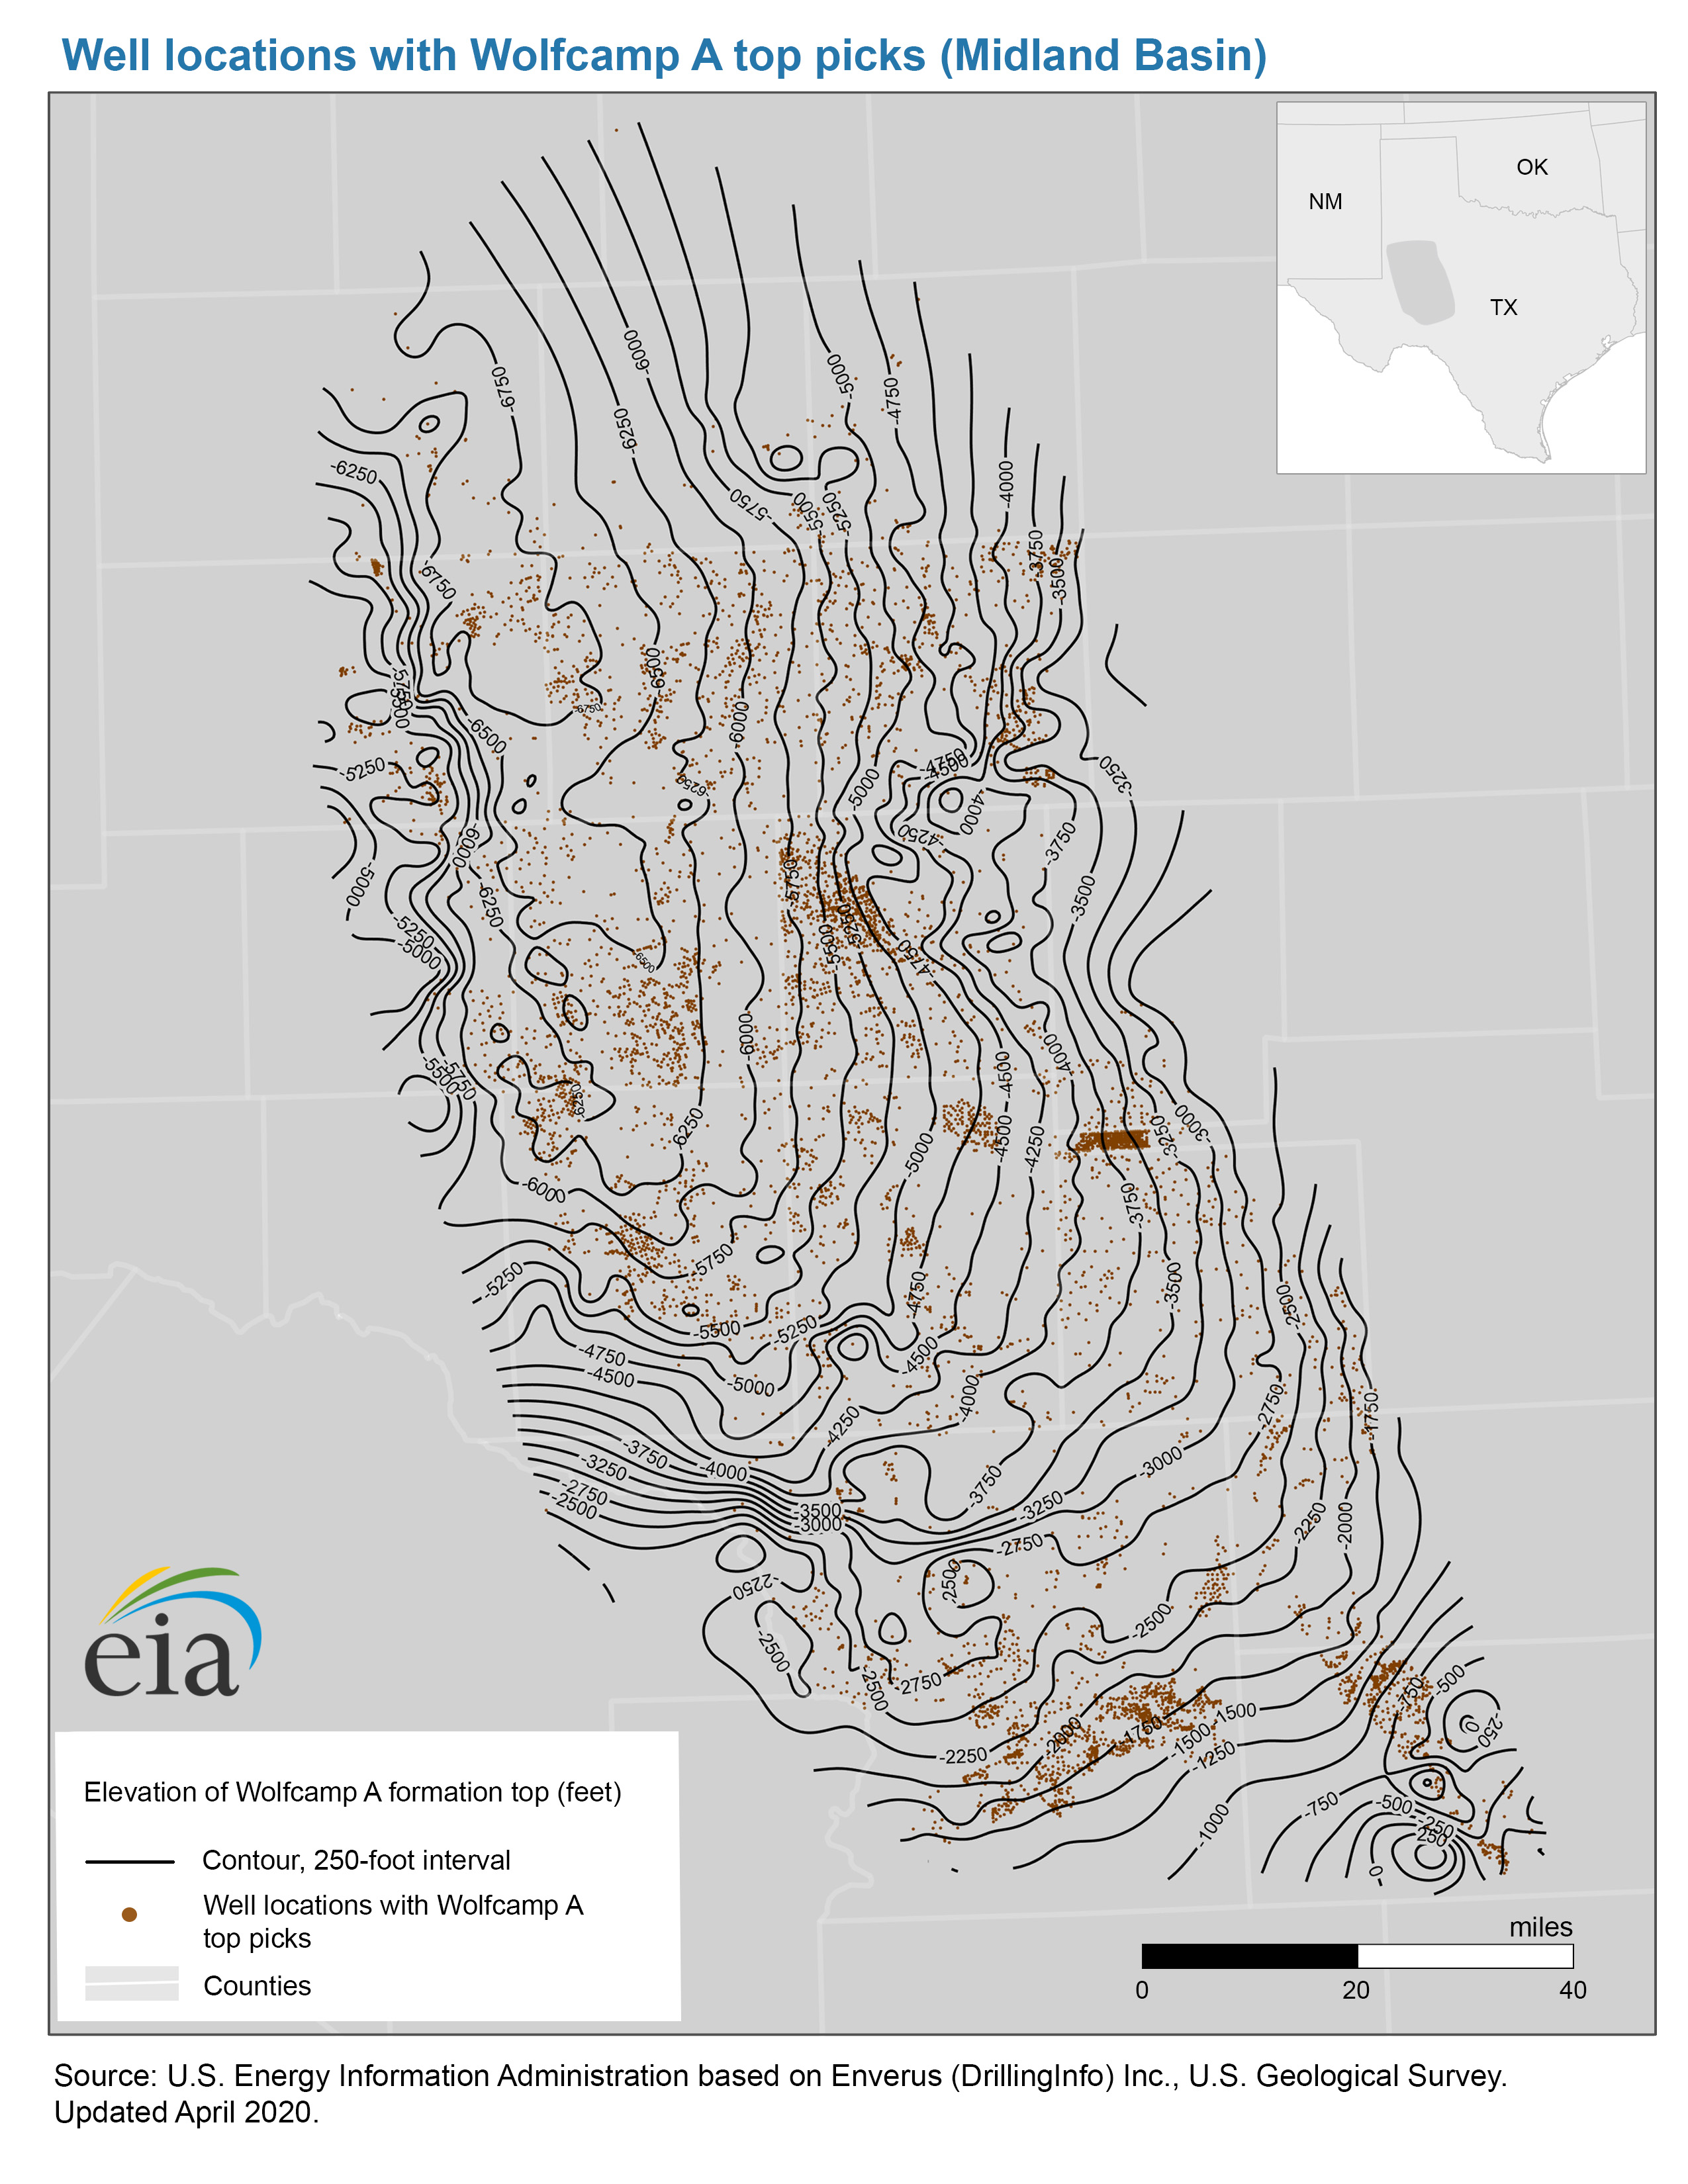
- Well locations with Wolfcamp A top picks map, Midland Basin (10/8/2020) PDF JPG
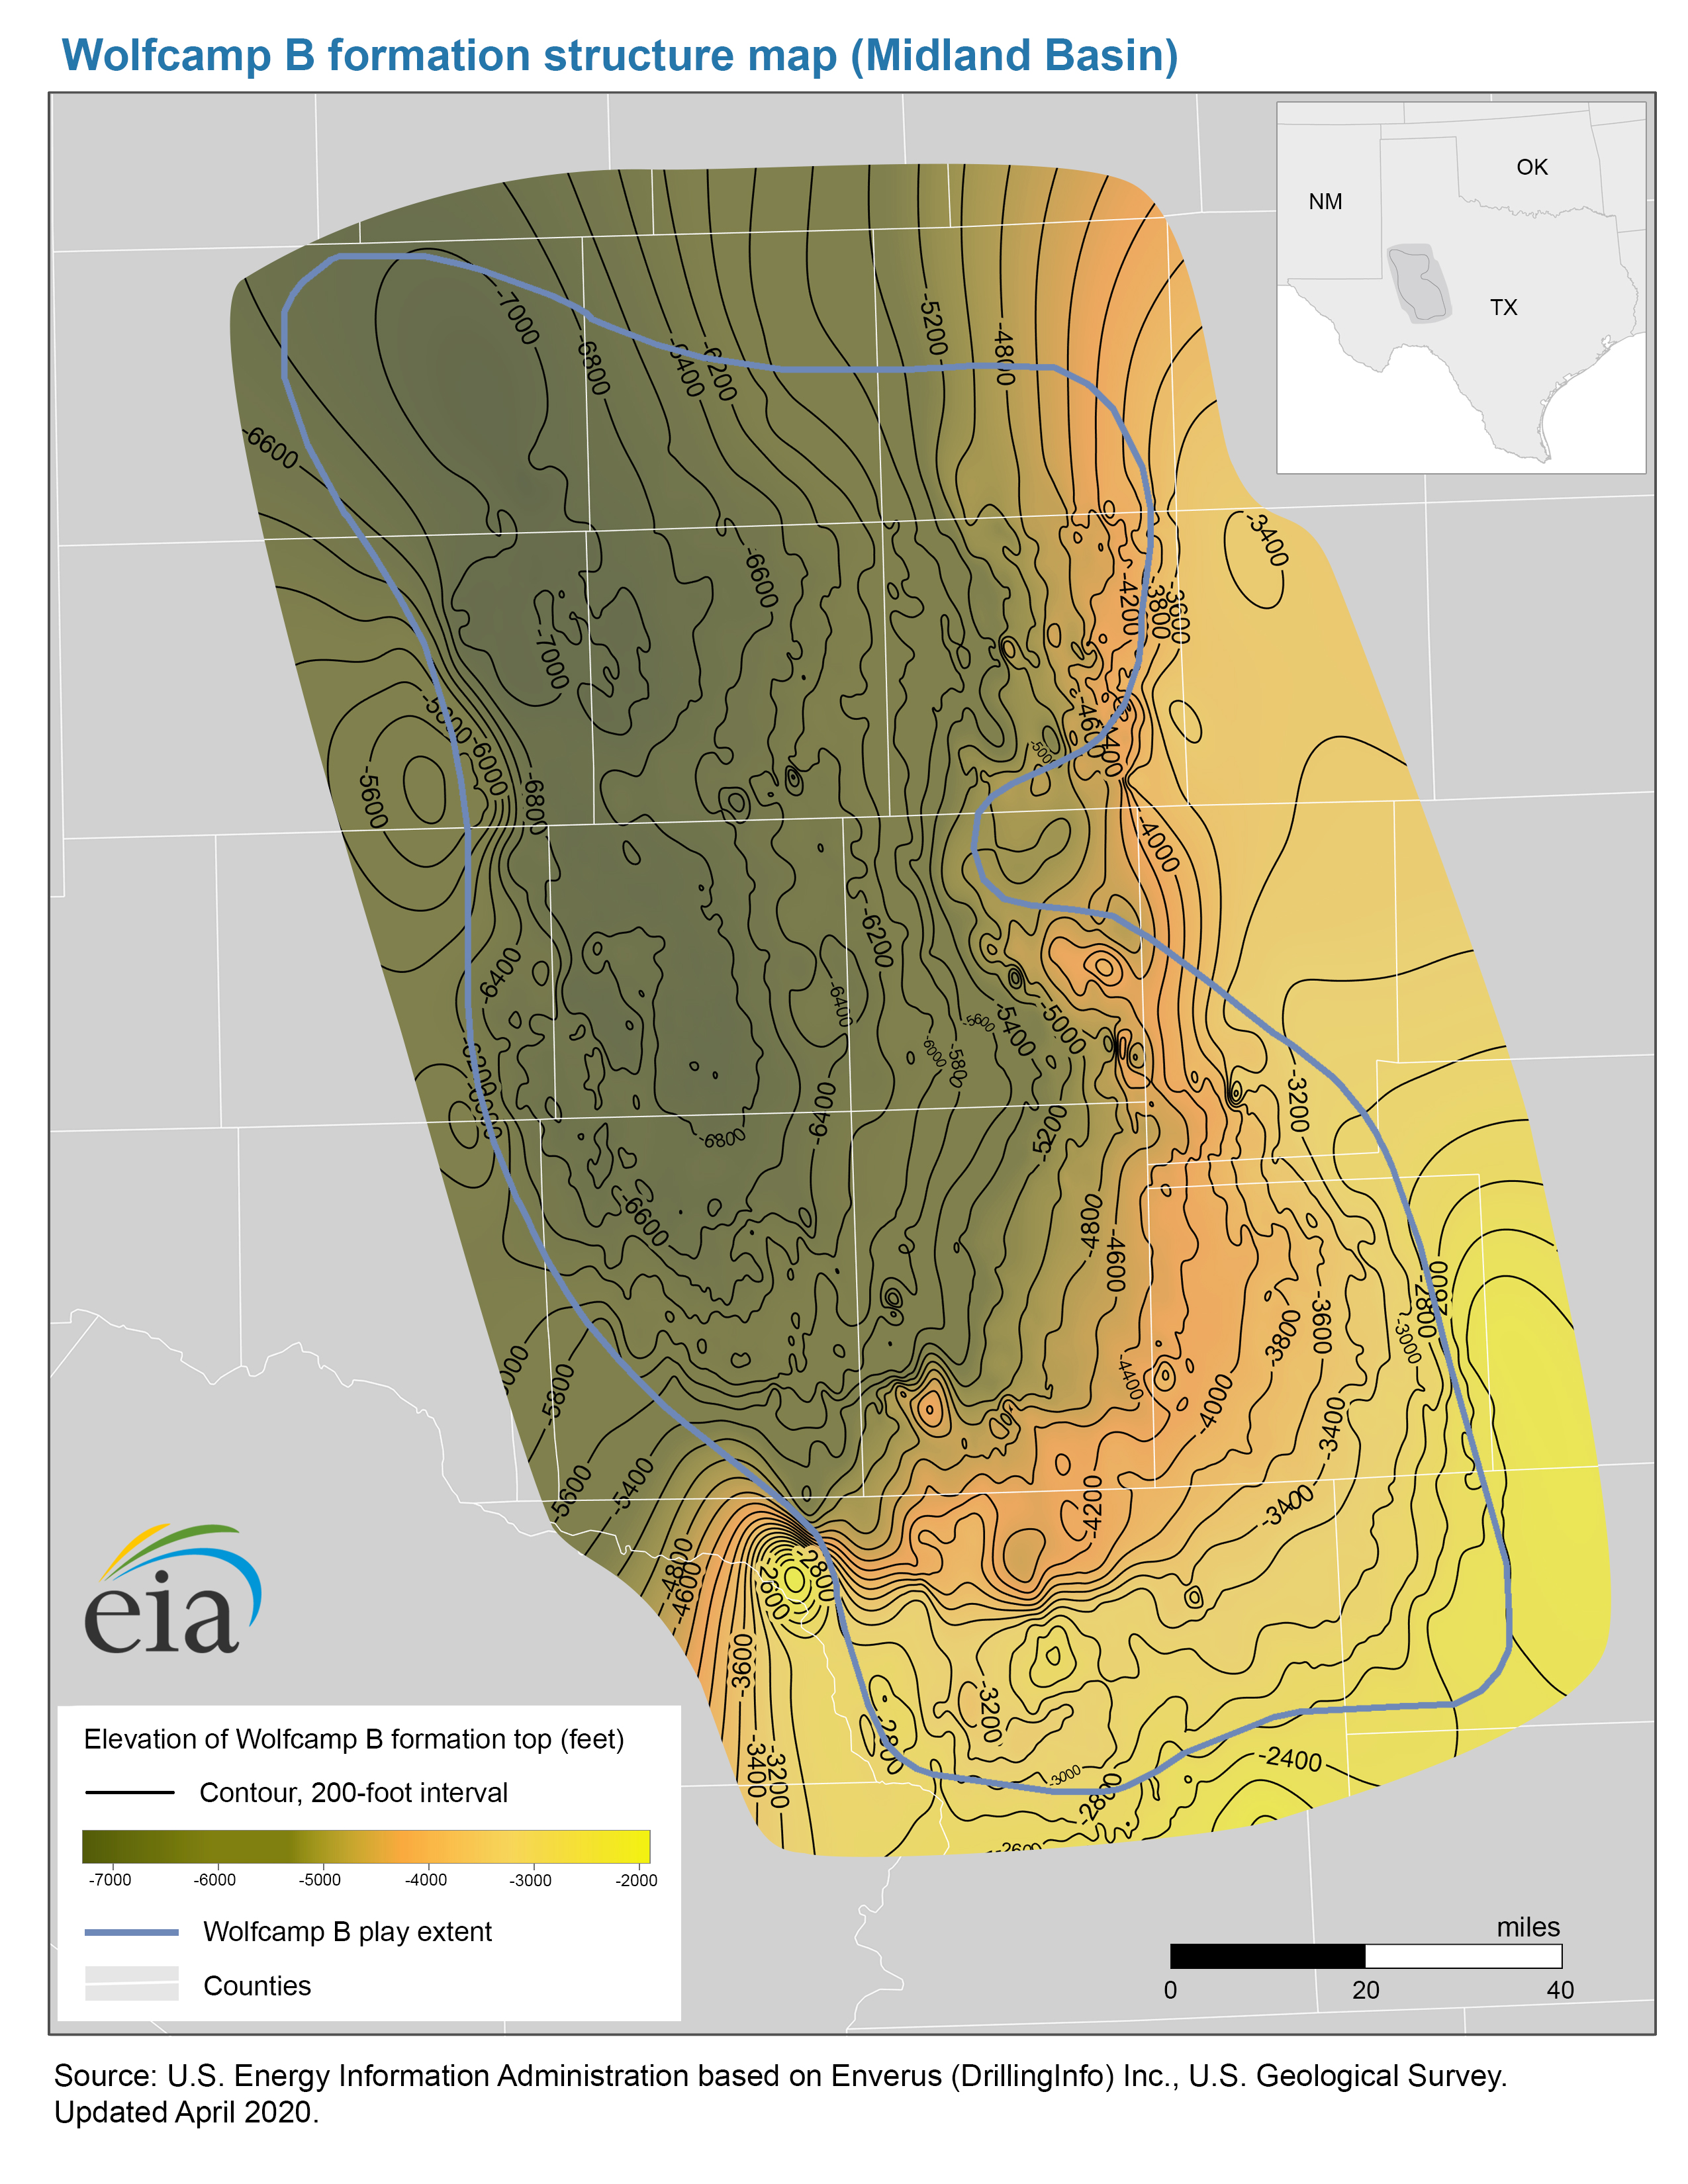
- Structure map of the Wolfcamp B formation, Midland Basin (4/23/2020) PDF JPG
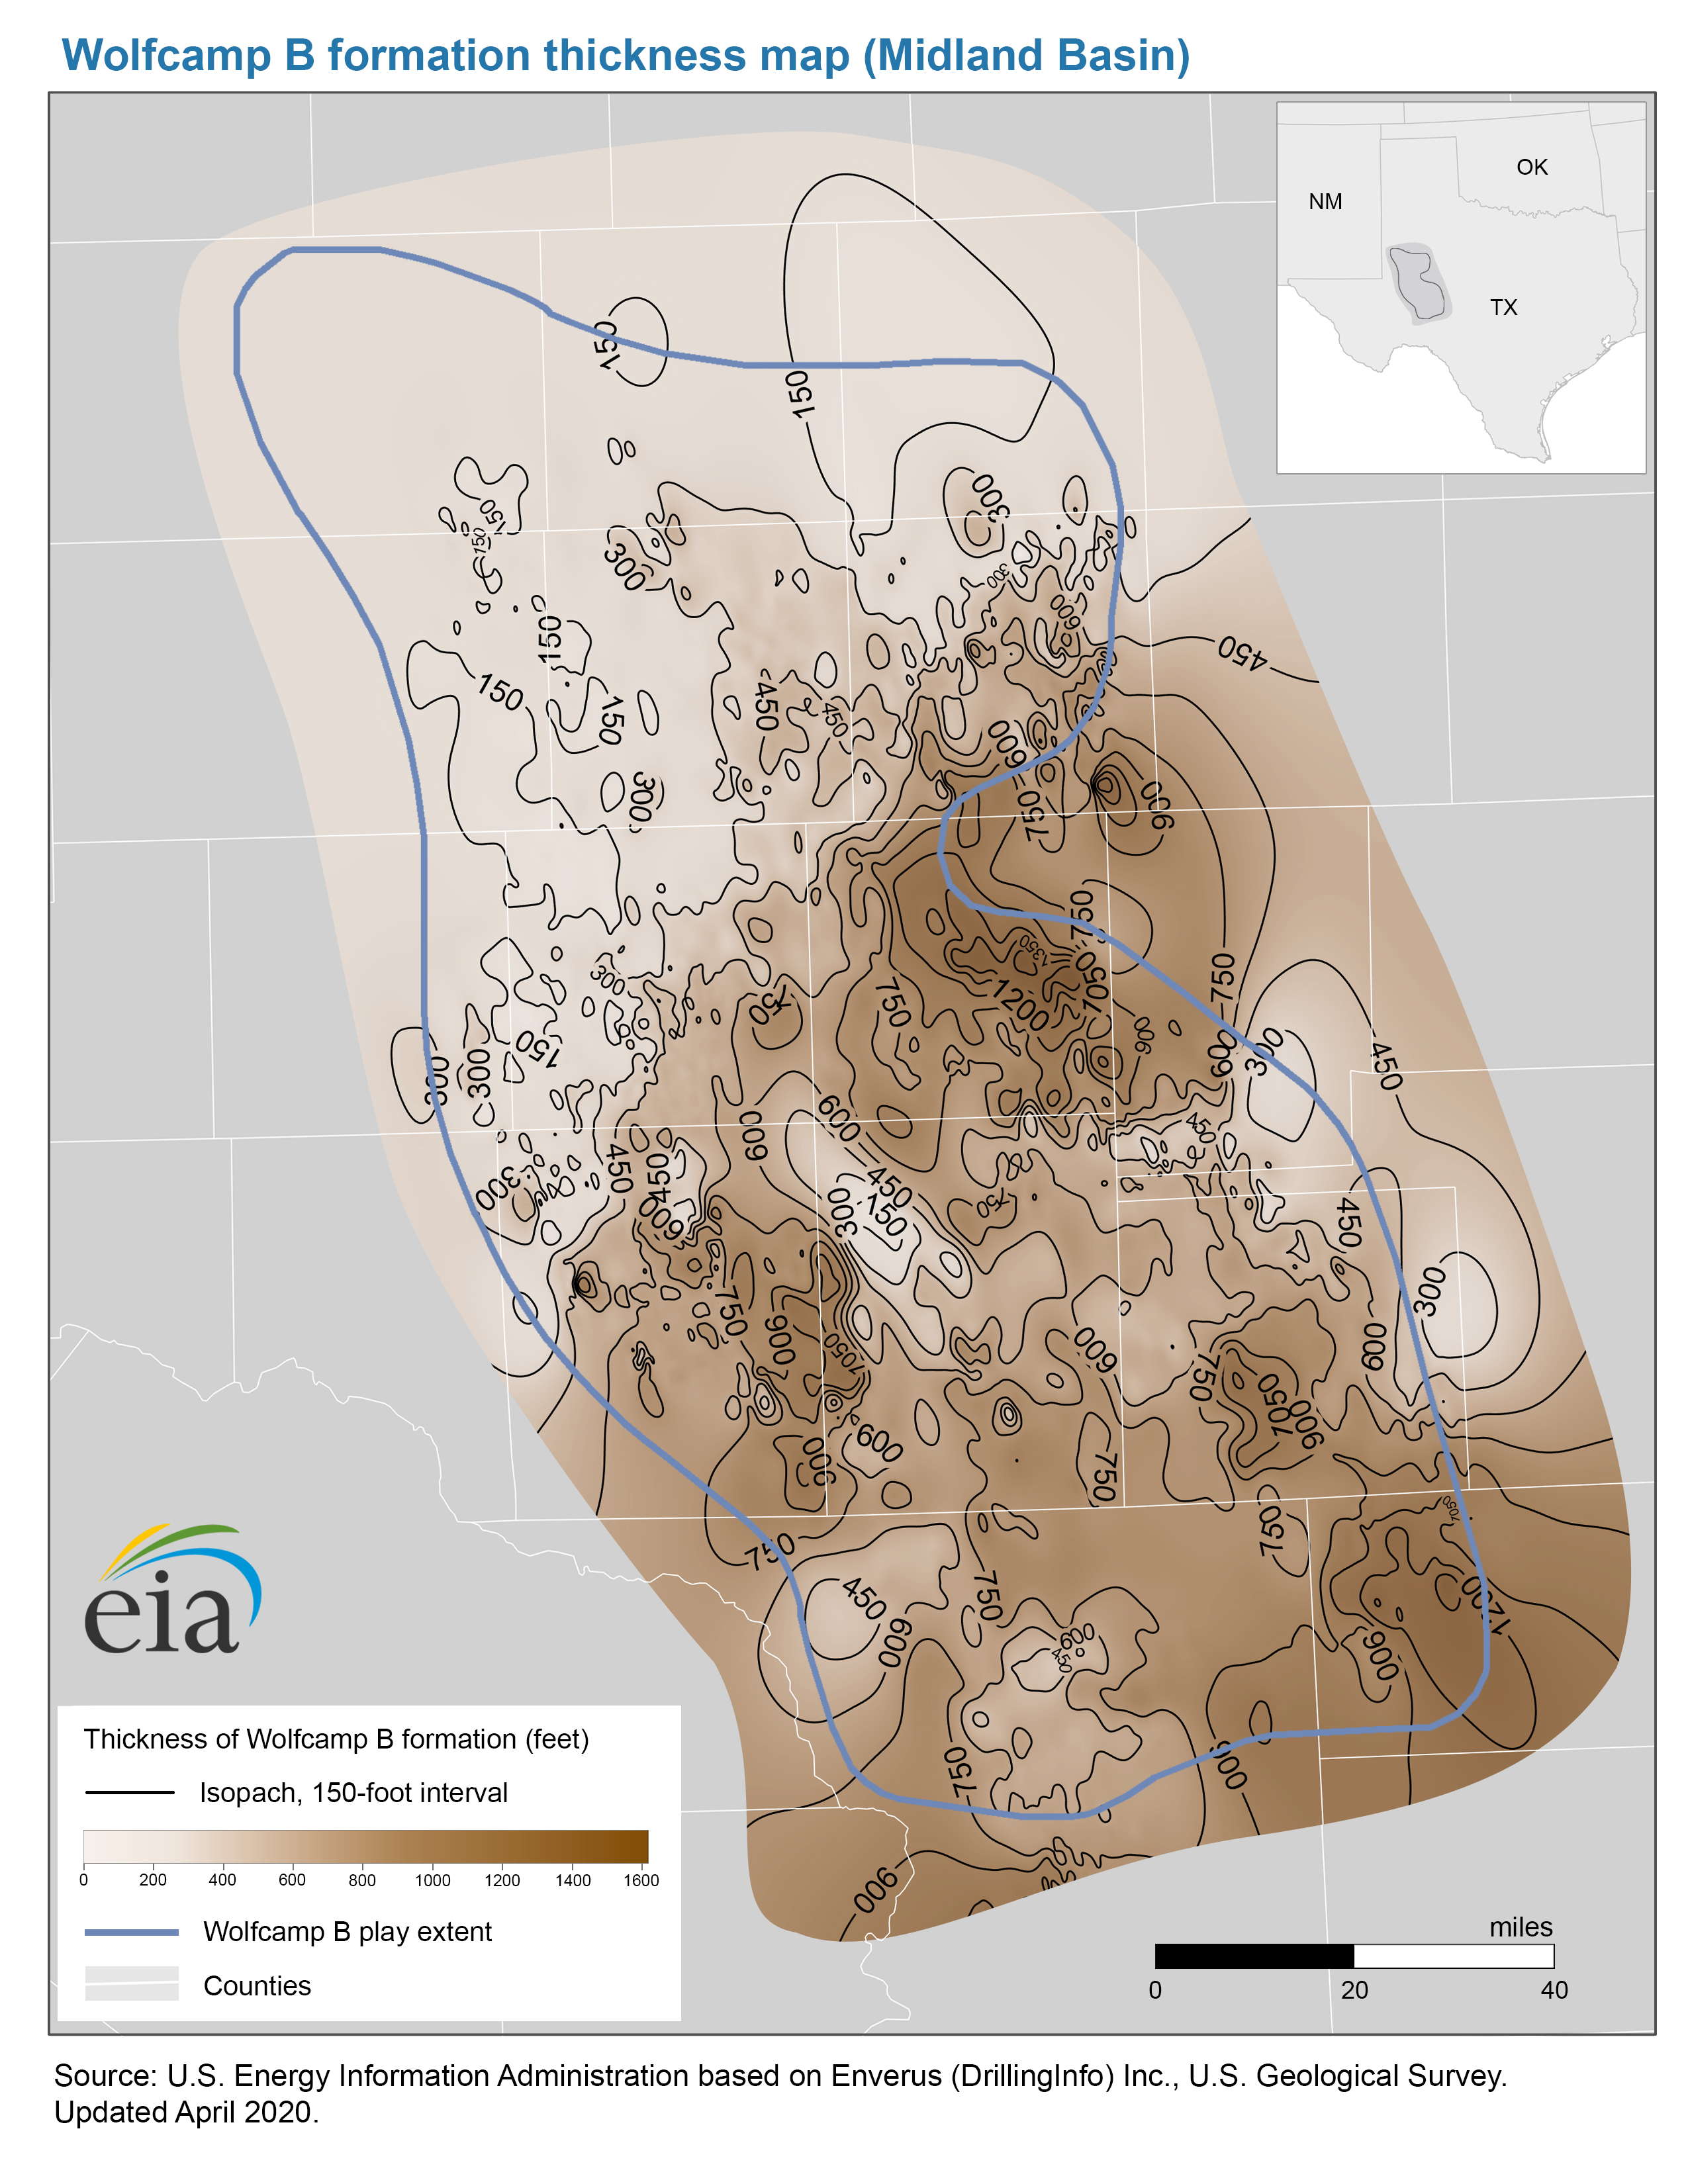
- Thickness map of the Wolfcamp B formation, Midland Basin (4/23/2020) PDF JPG
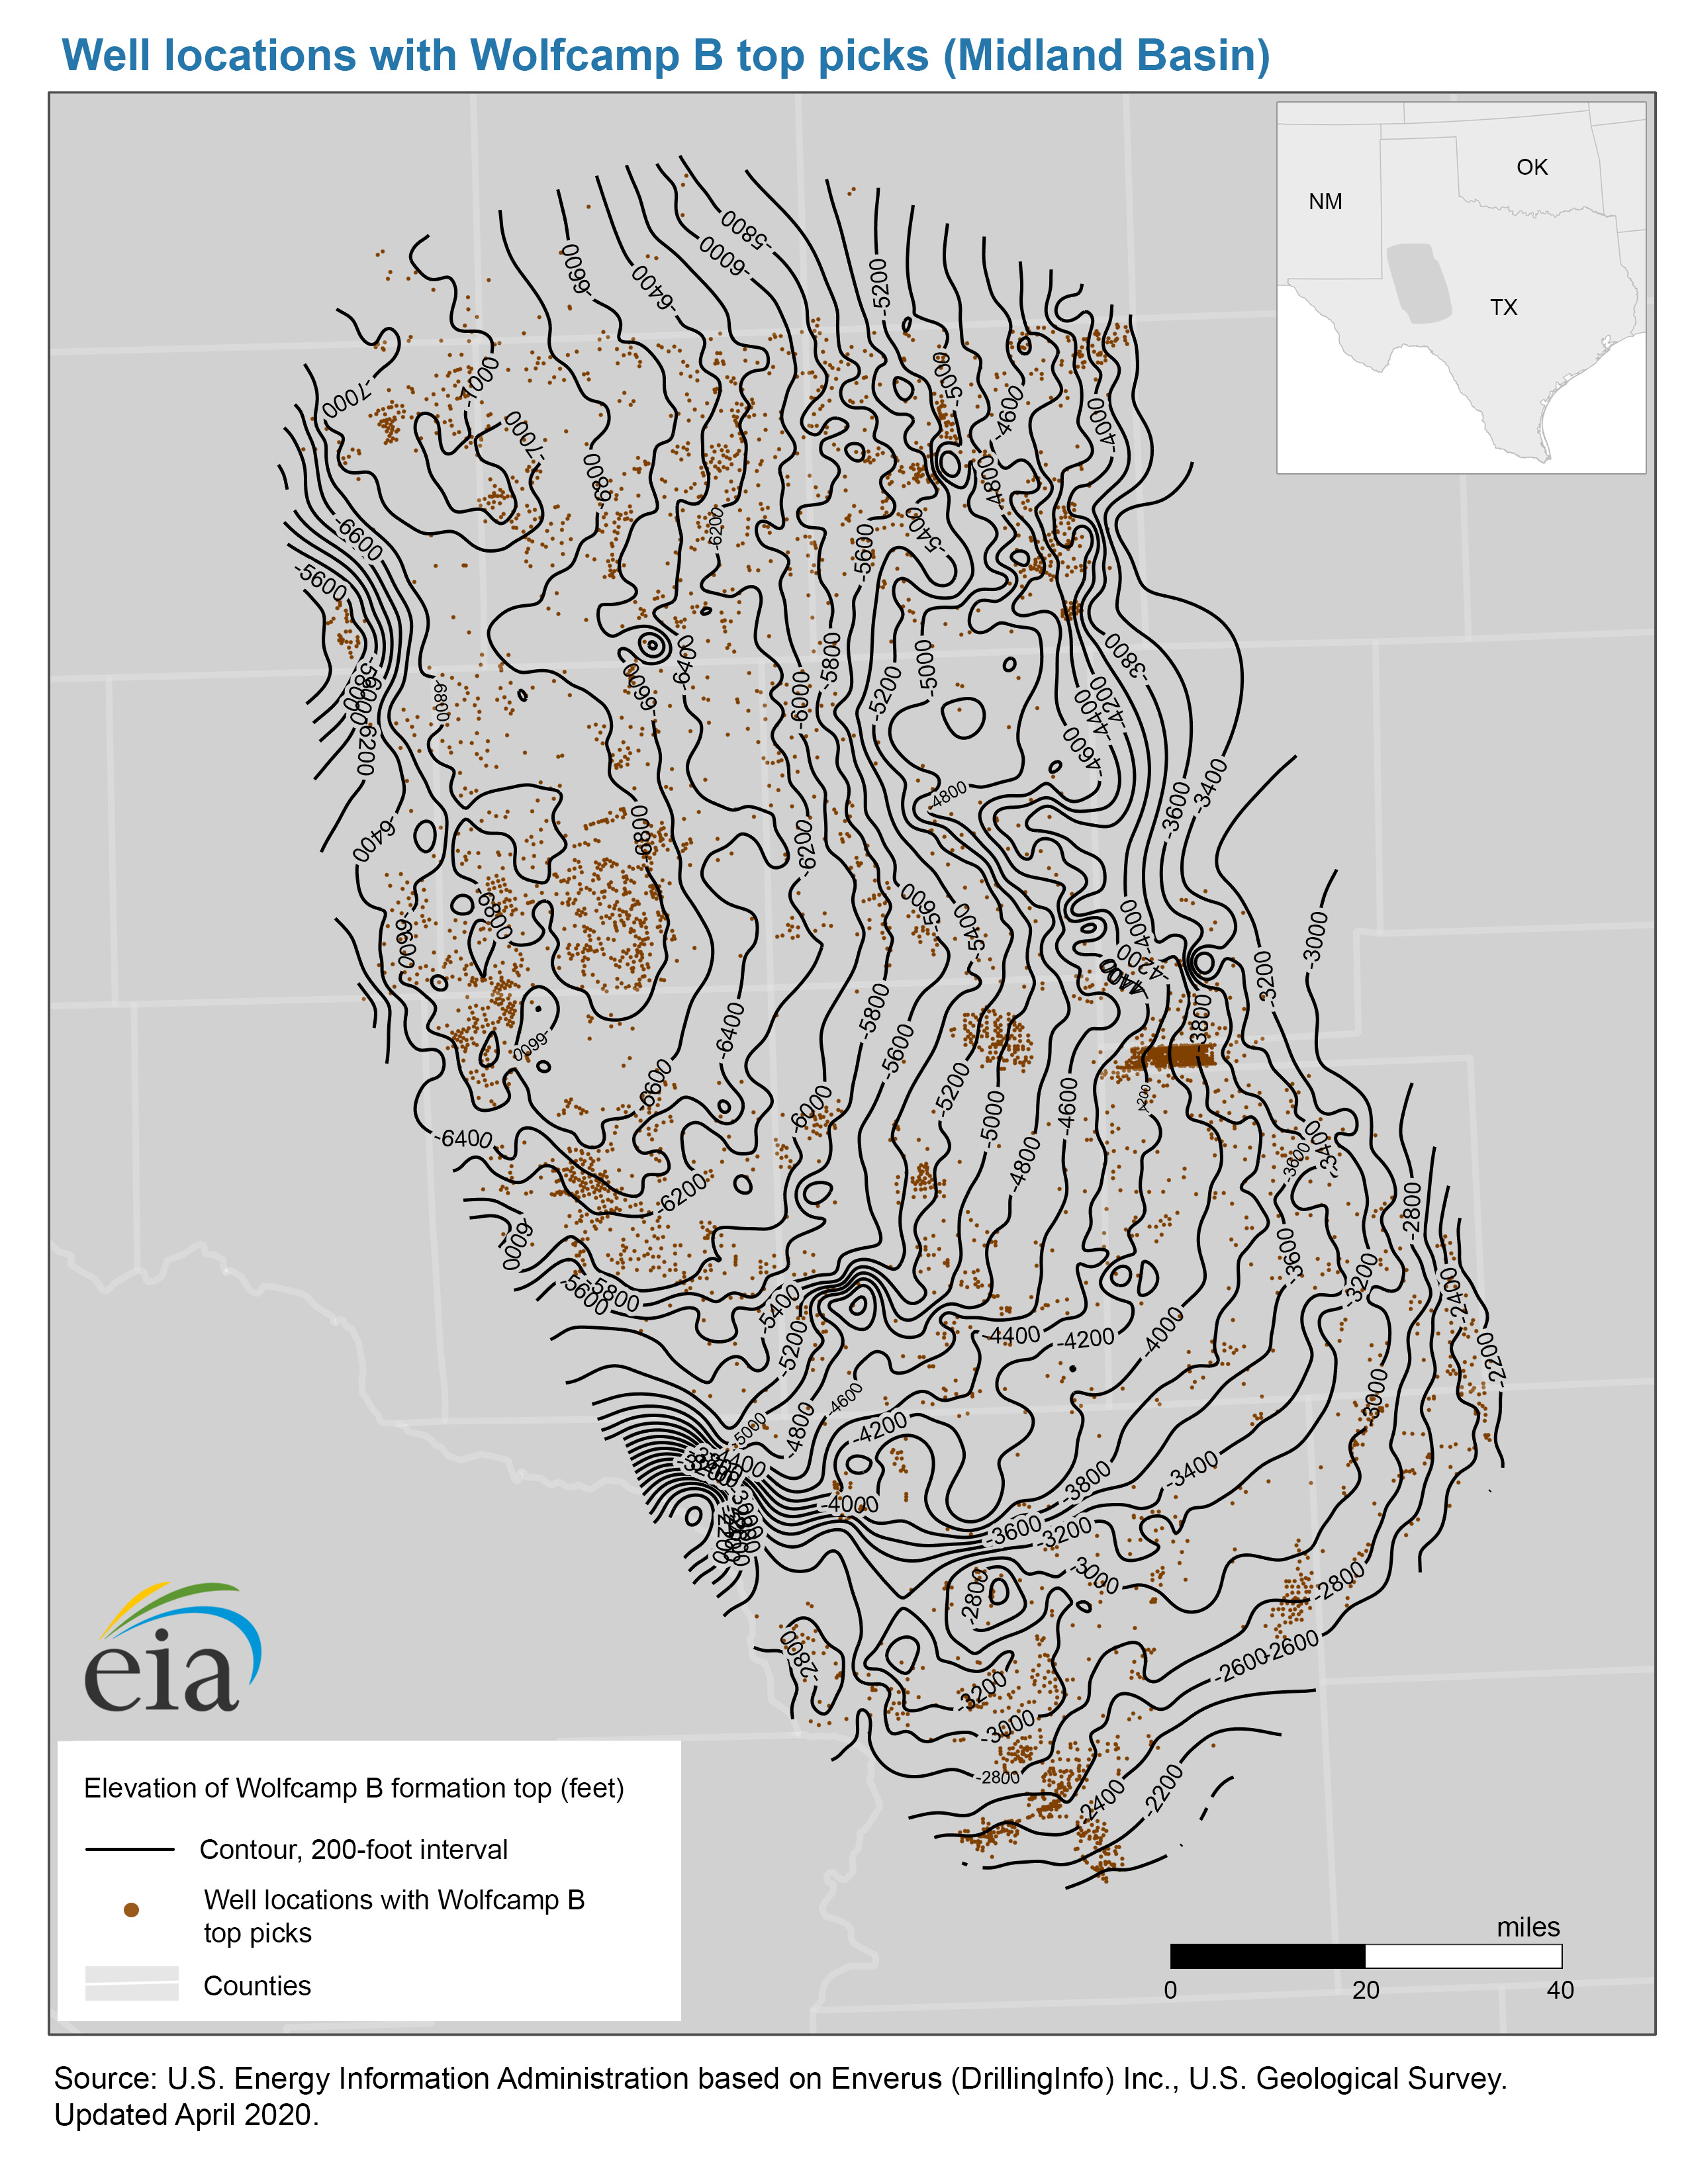
- Well locations with Wolfcamp B top picks map, Midland Basin (10/8/2020) PDF JPG
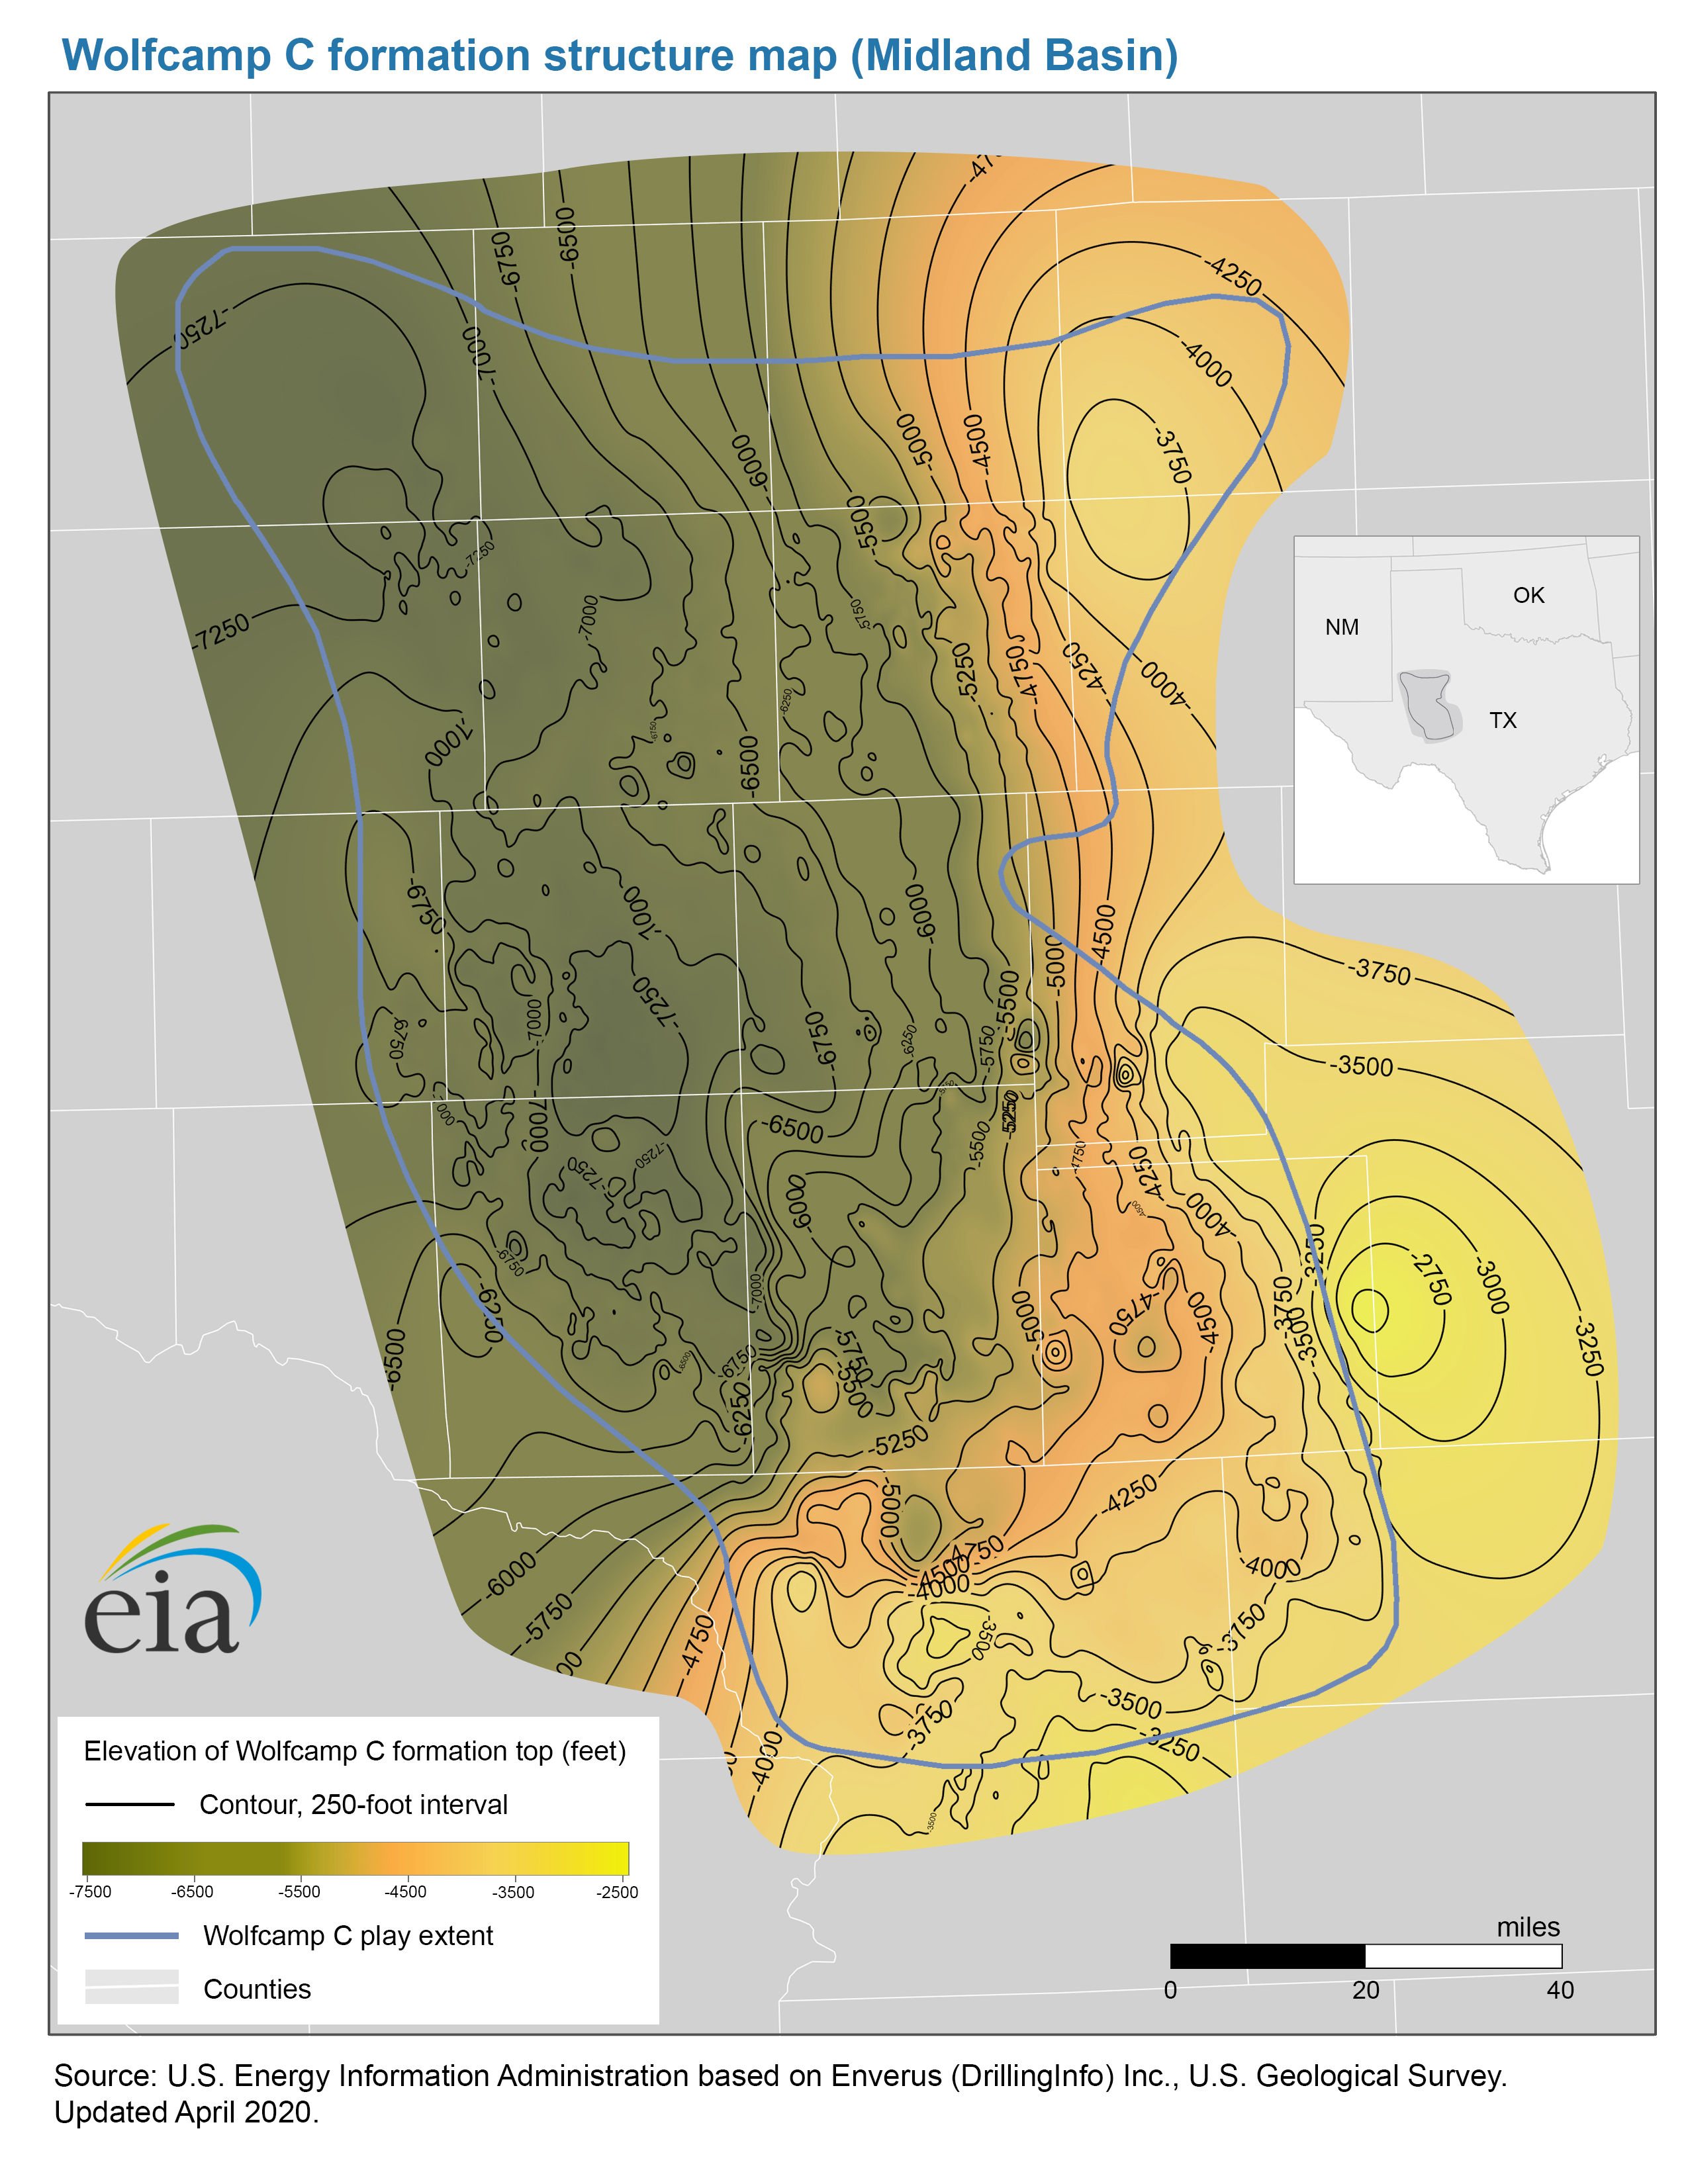
- Structure map of the Wolfcamp C formation, Midland Basin (4/23/2020) PDF JPG
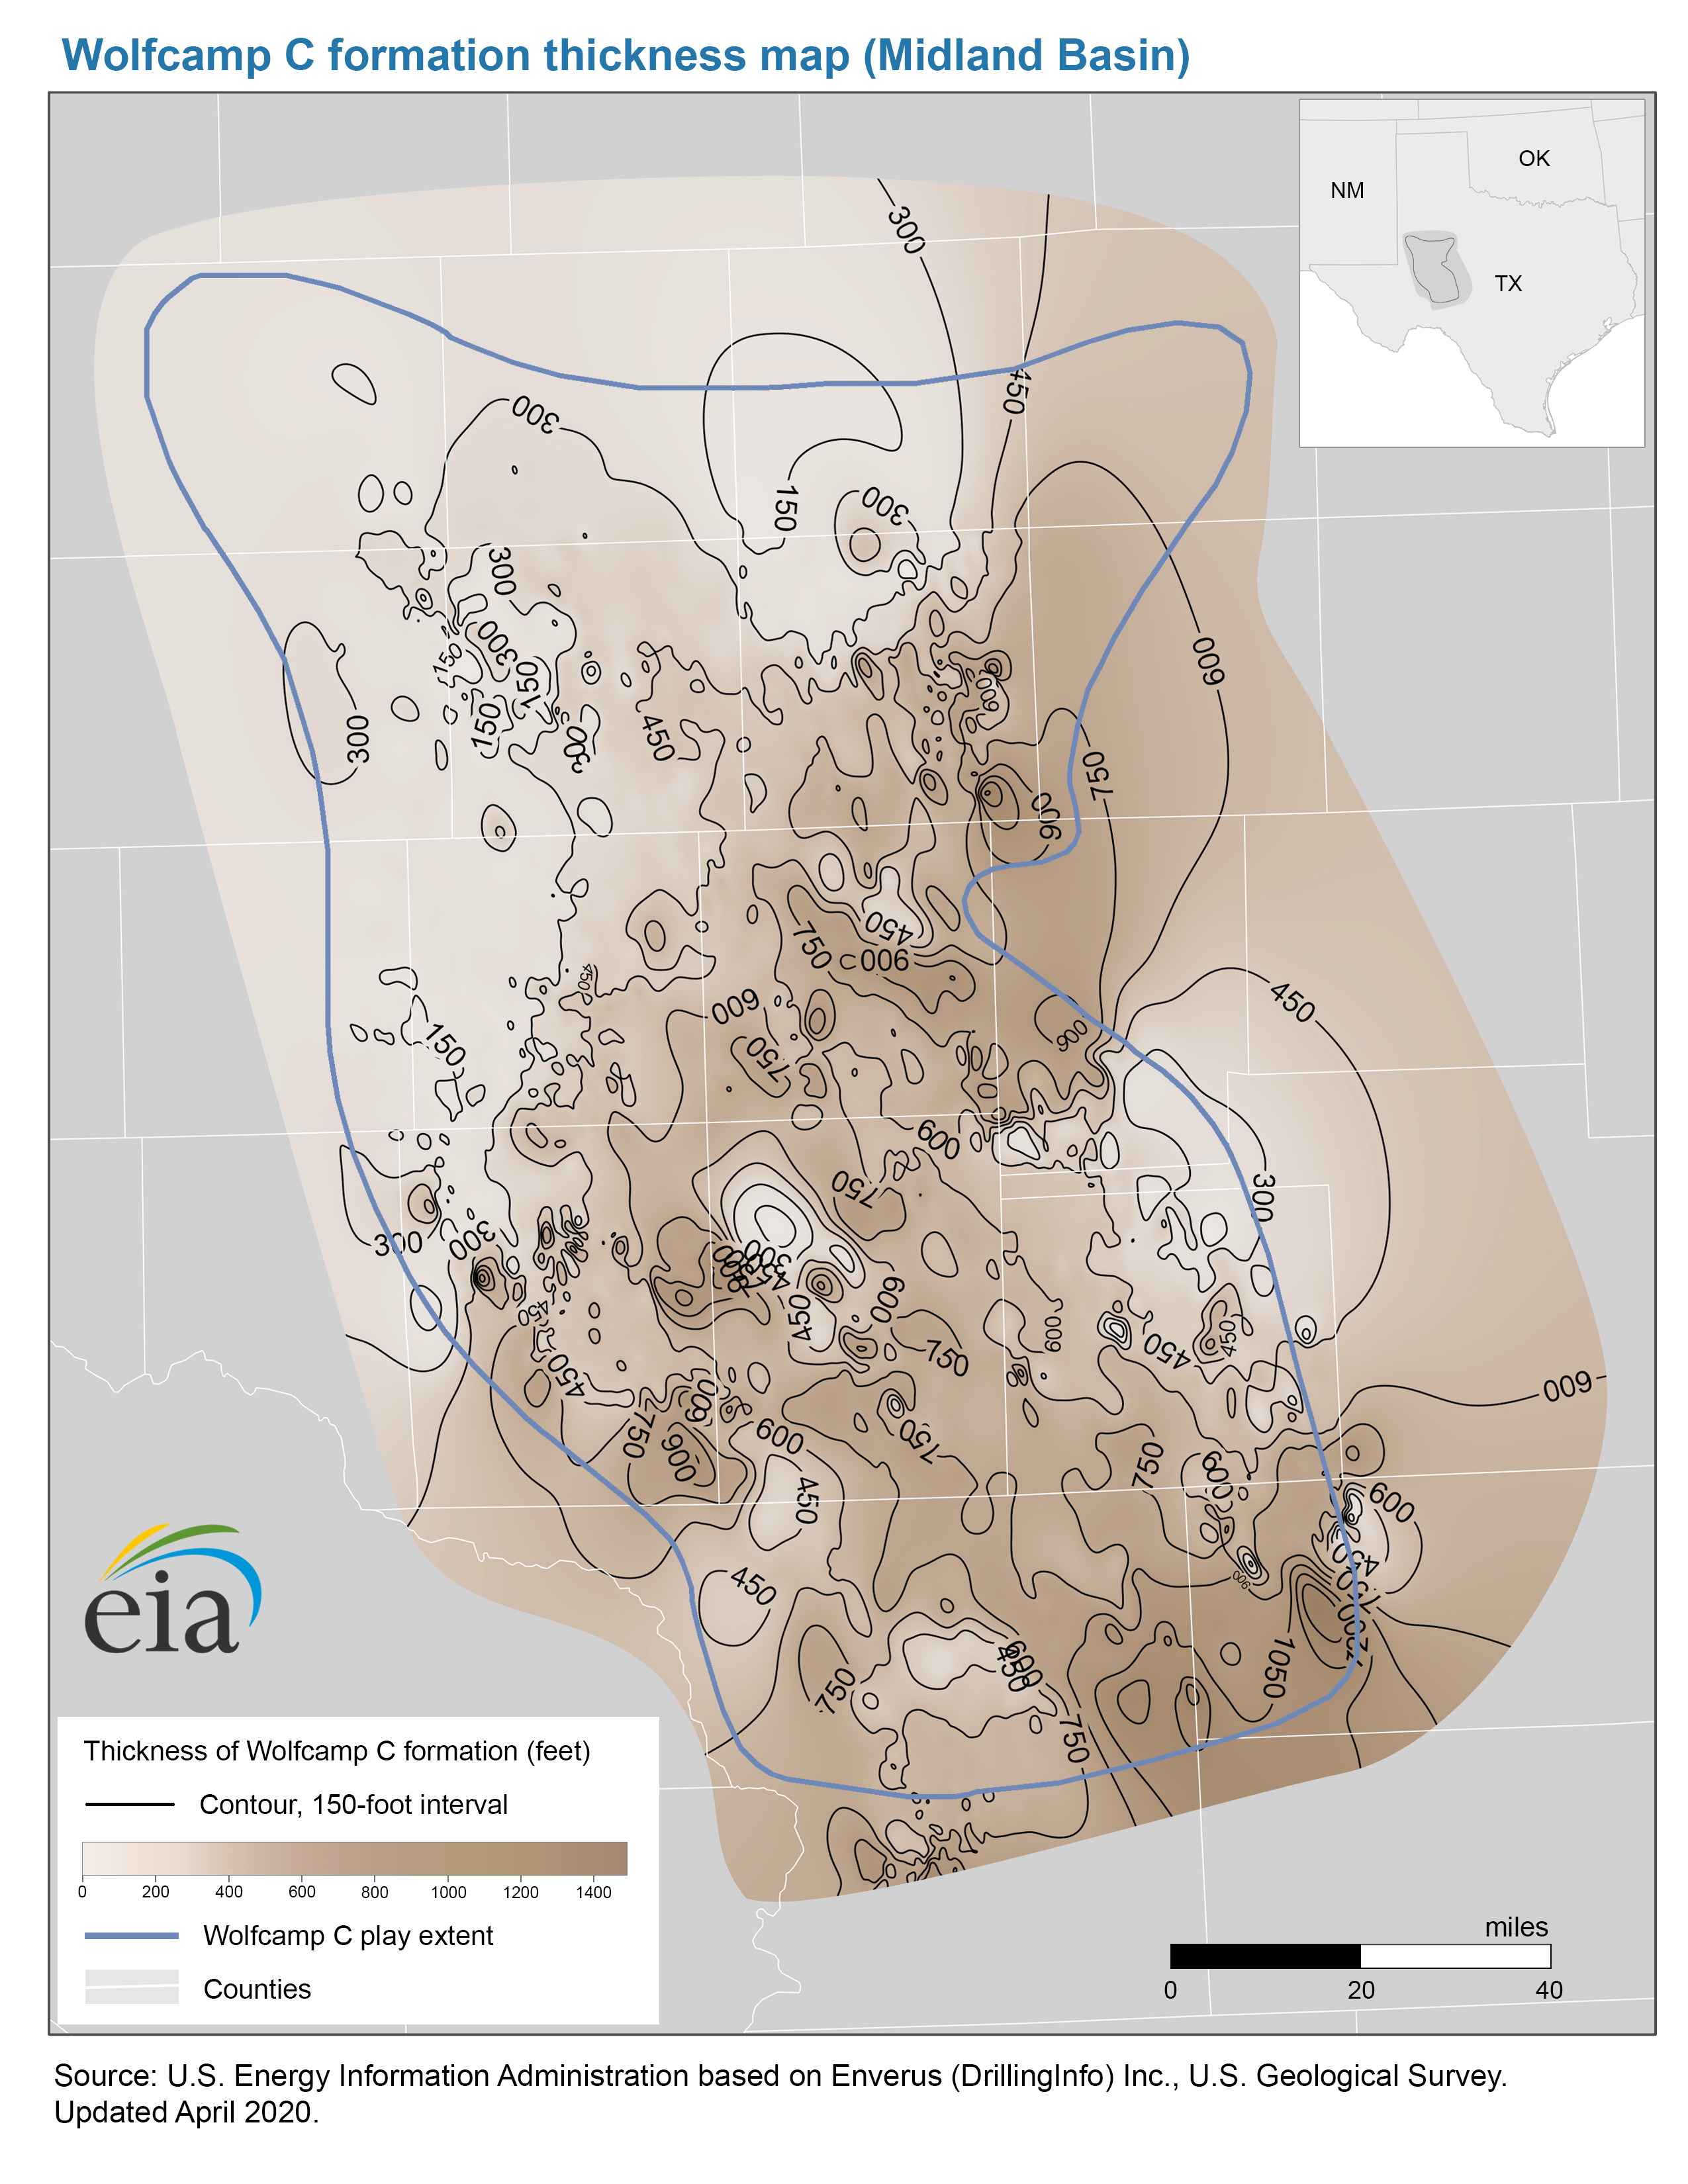
- Thickness map of the Wolfcamp C formation, Midland Basin (4/23/2020) PDF JPG
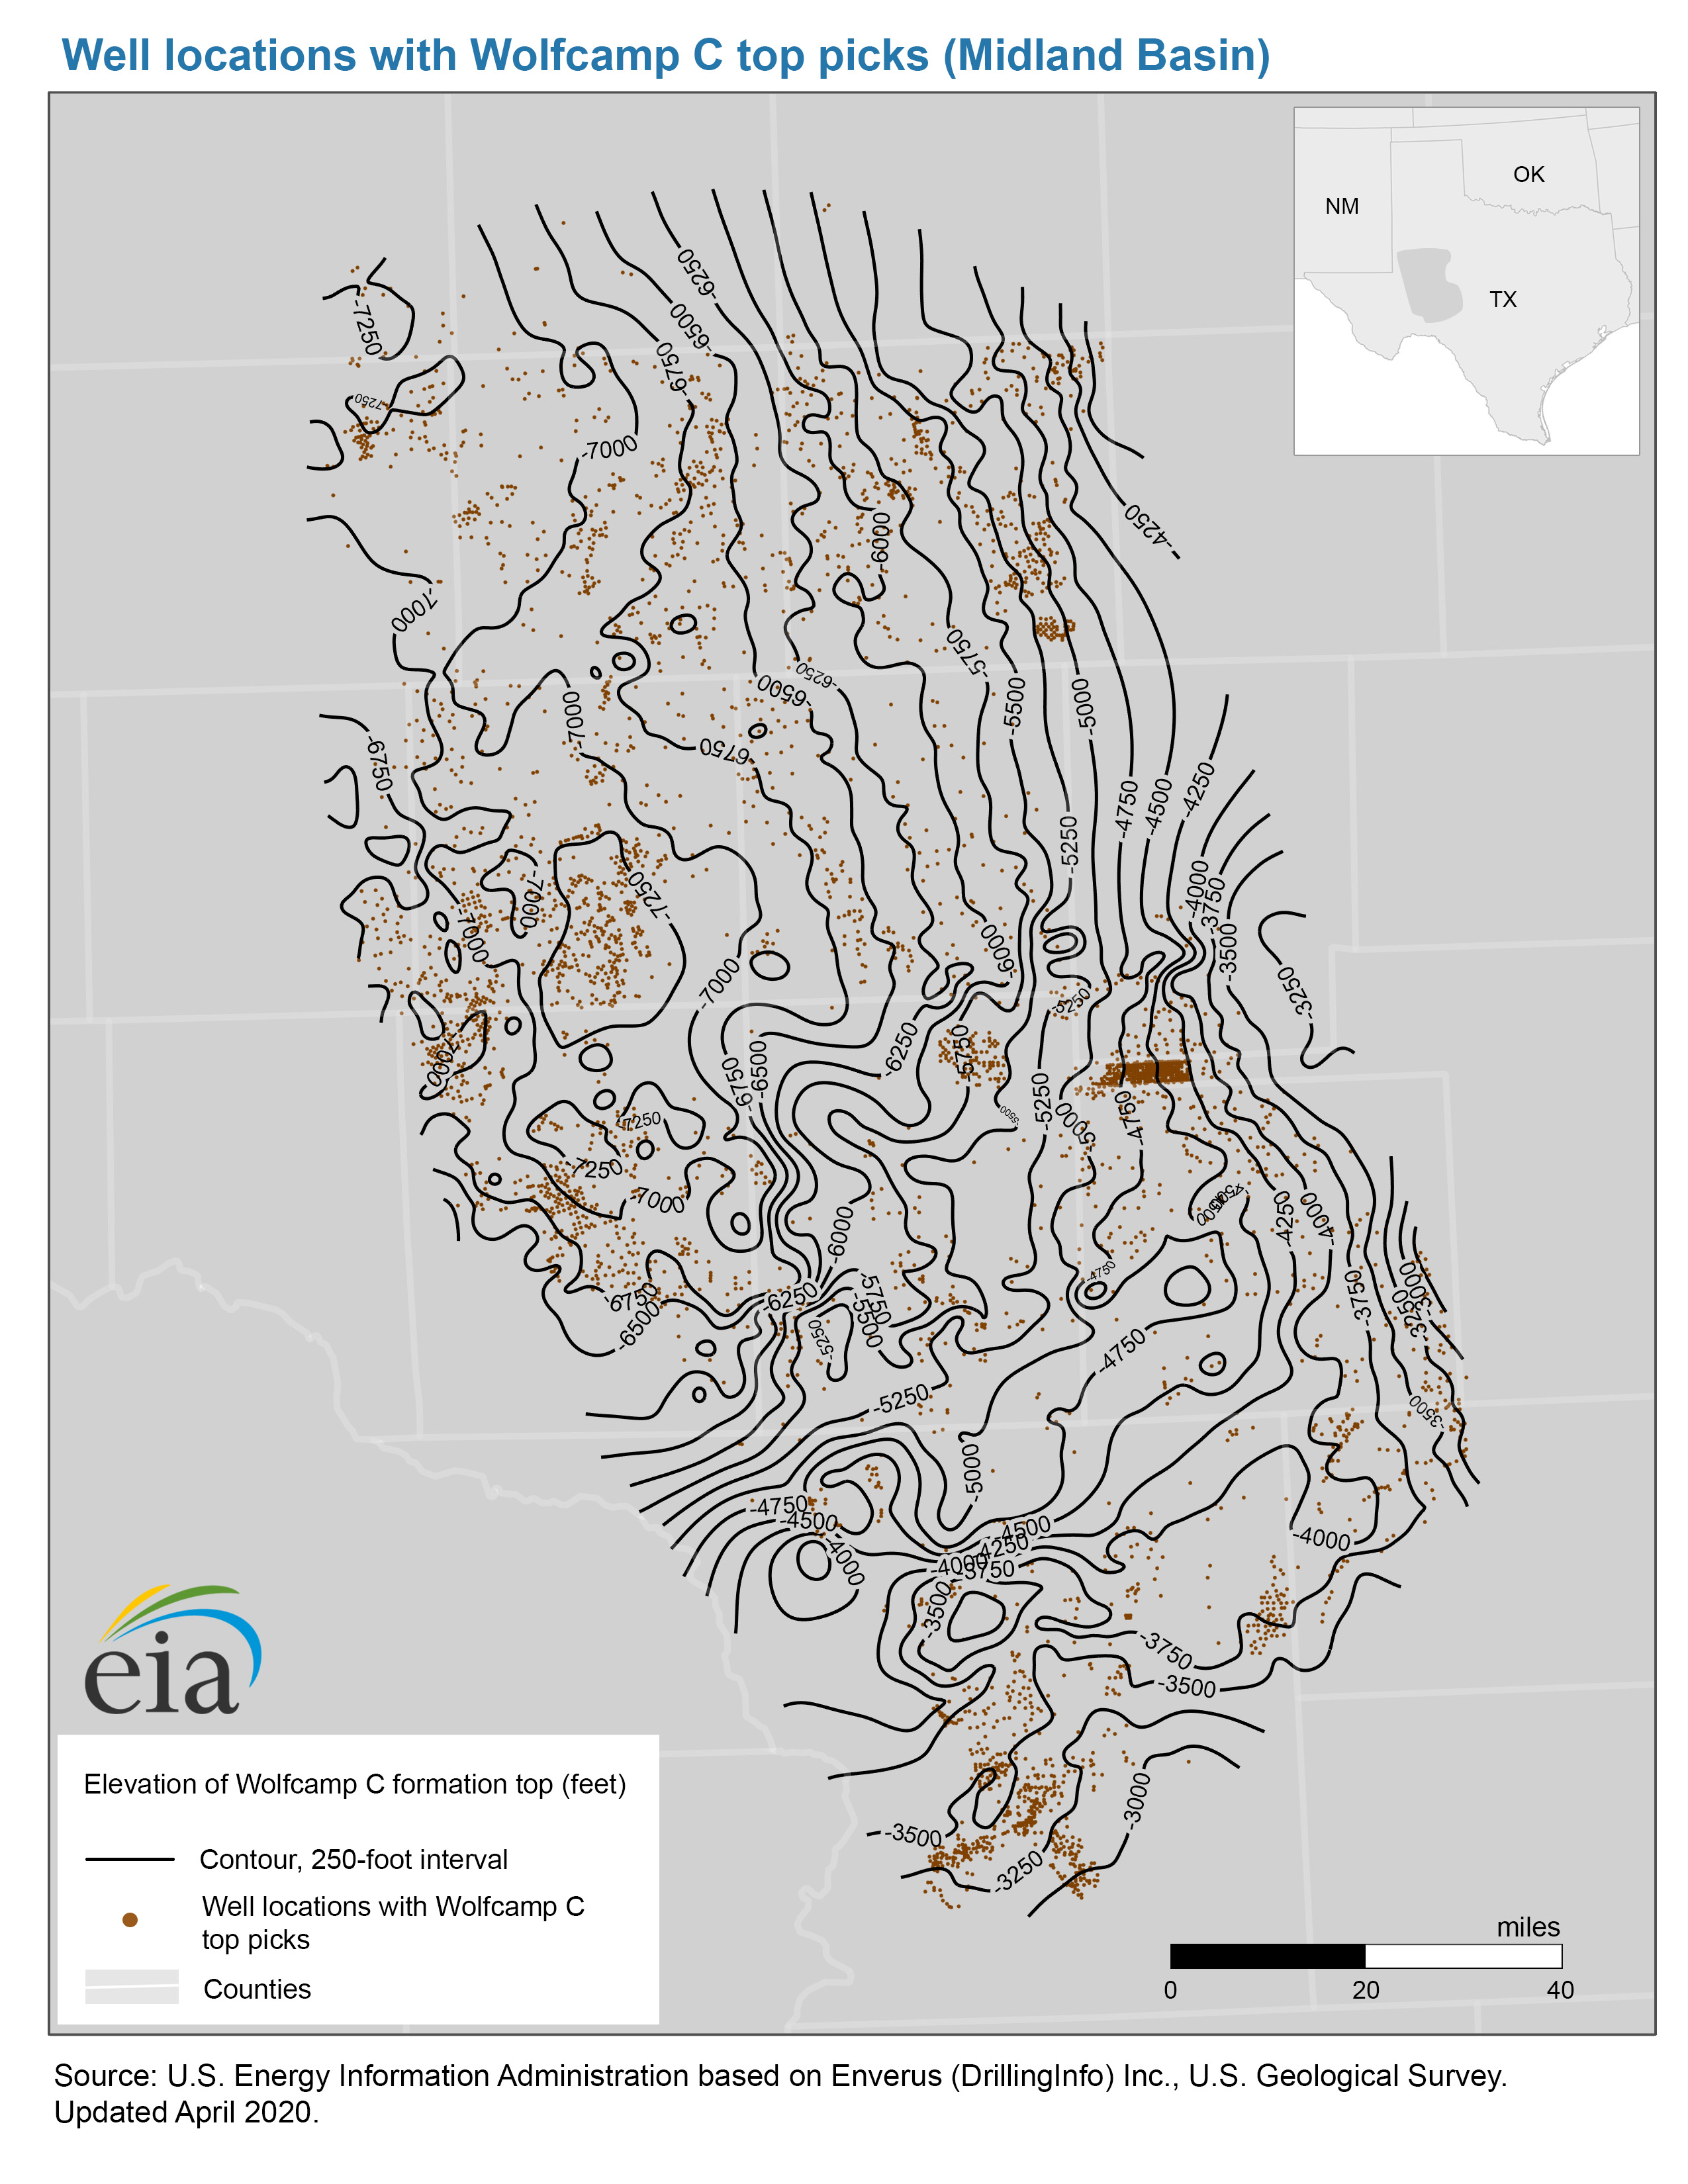
- Well locations with Wolfcamp C top picks map, Midland Basin (10/8/2020) PDF JPG
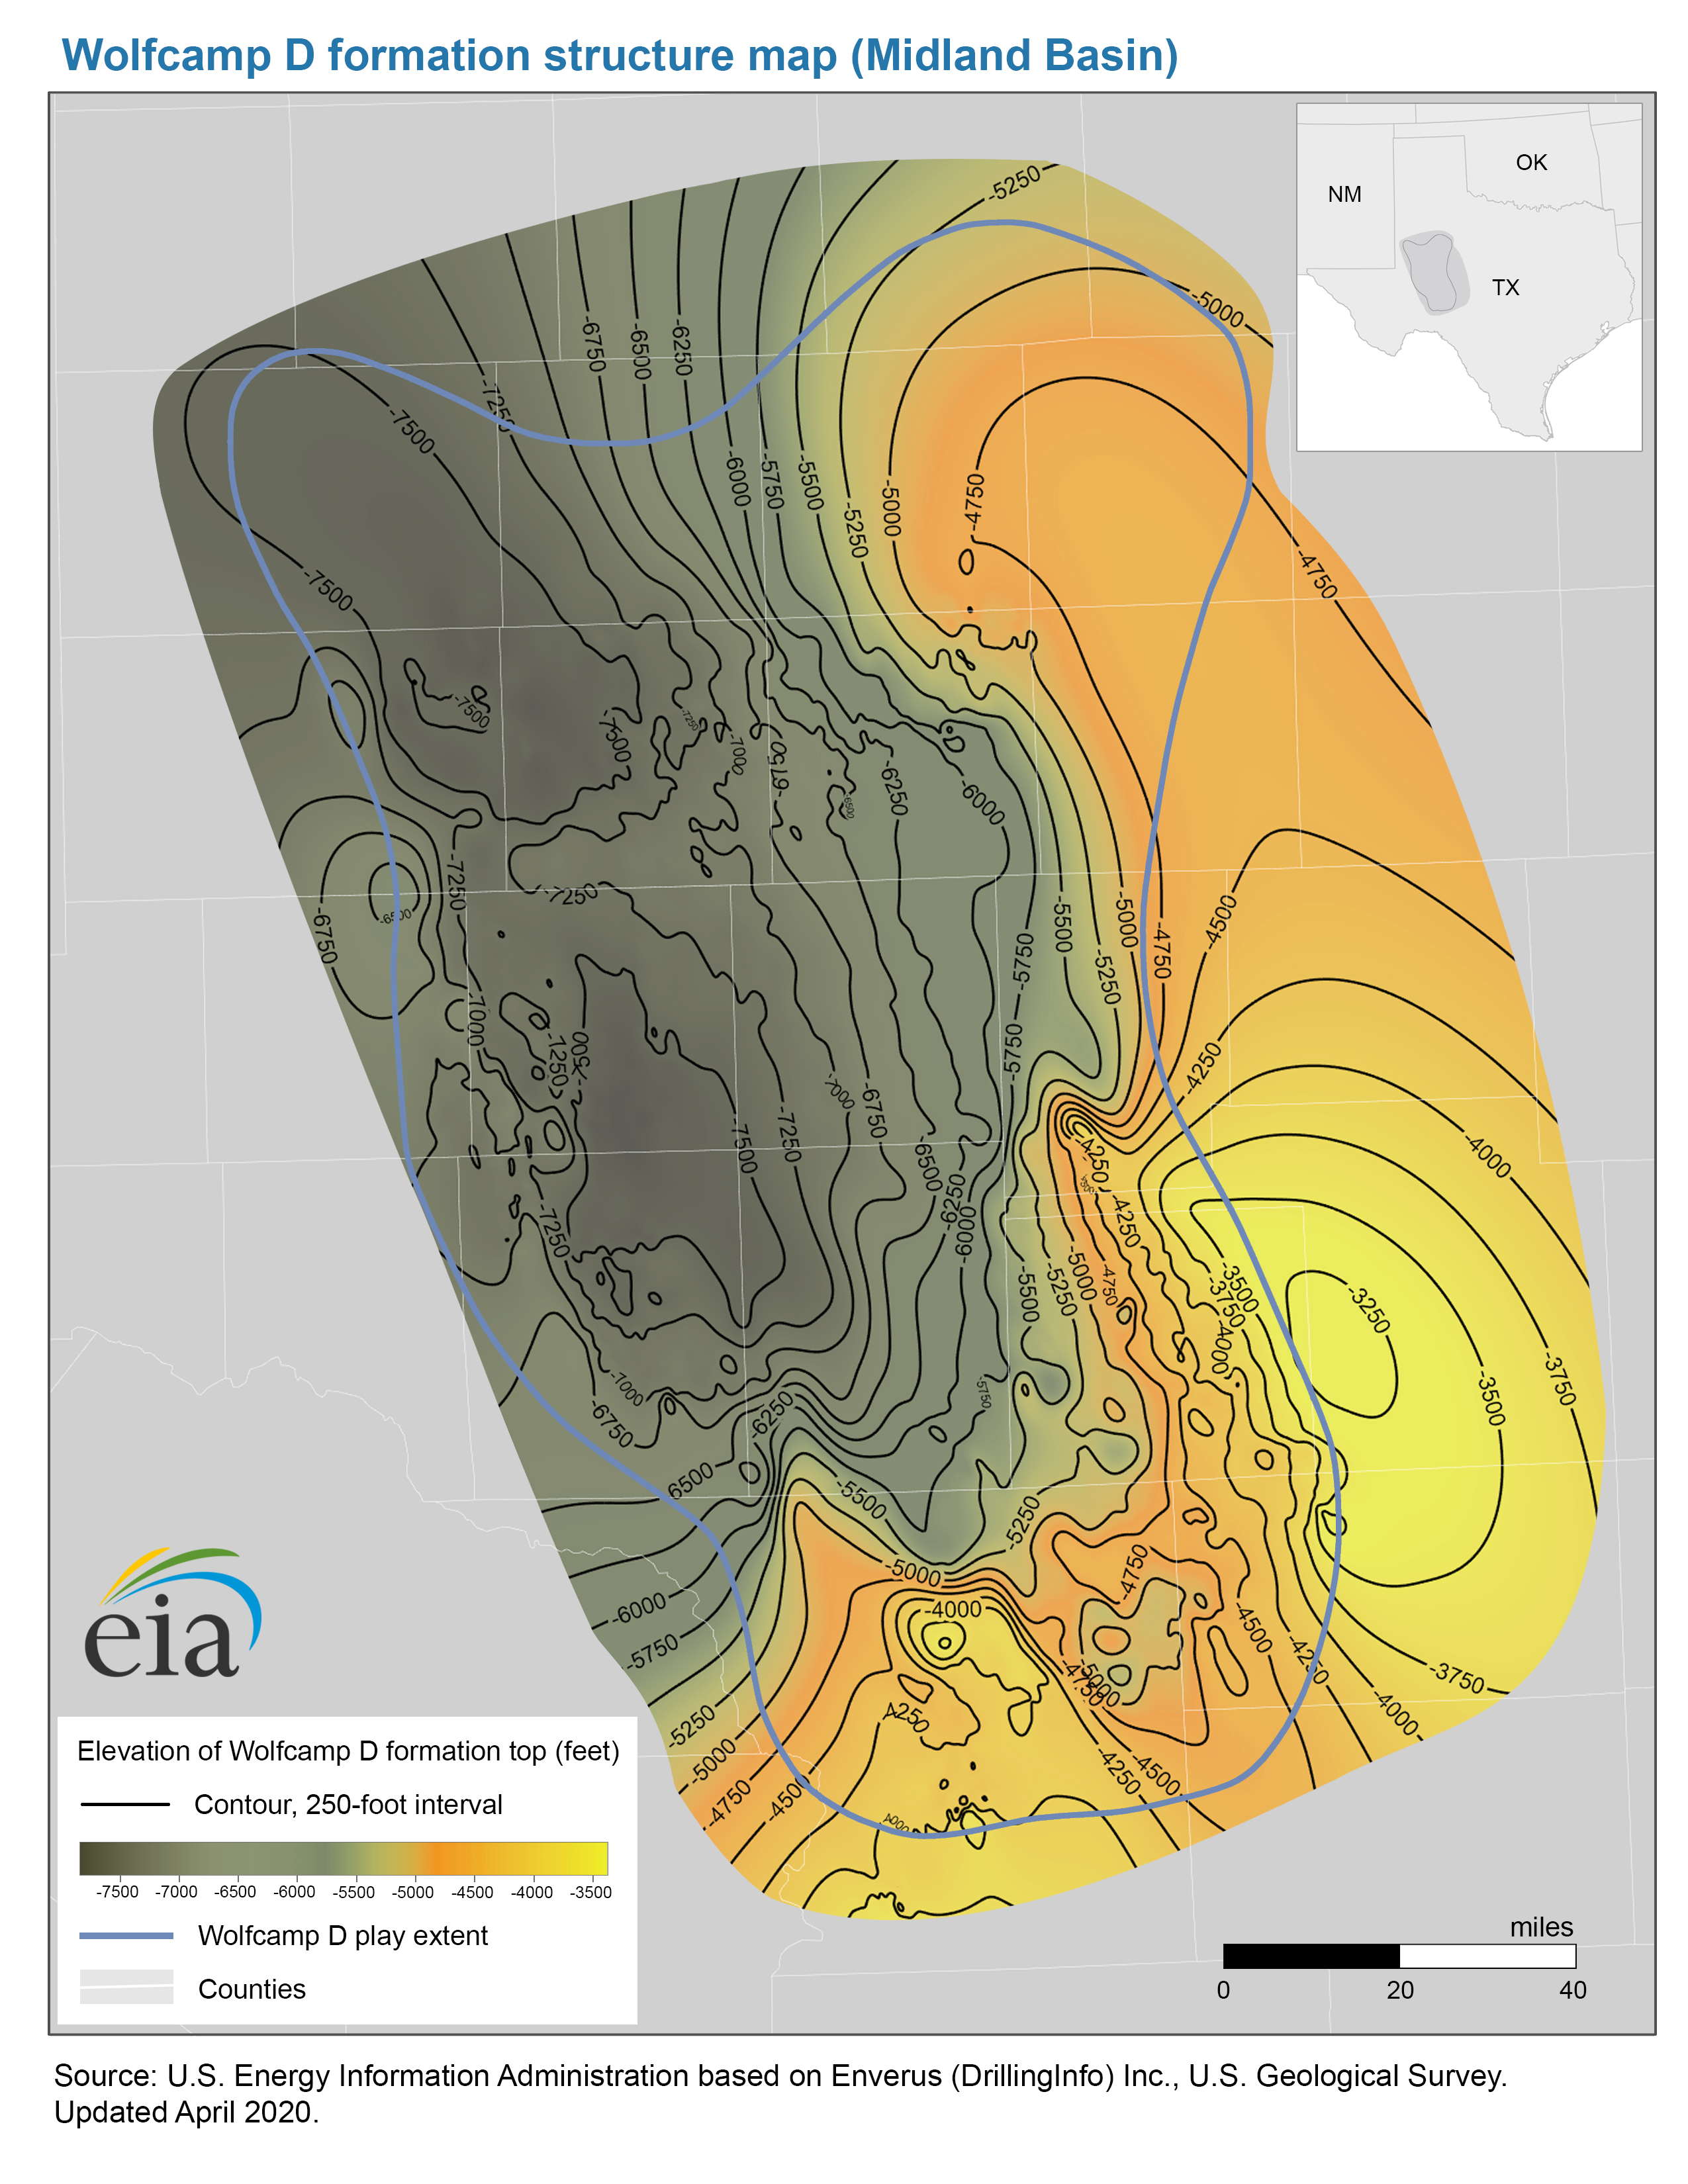
- Structure map of the Wolfcamp D formation, Midland Basin (4/23/2020) PDF JPG
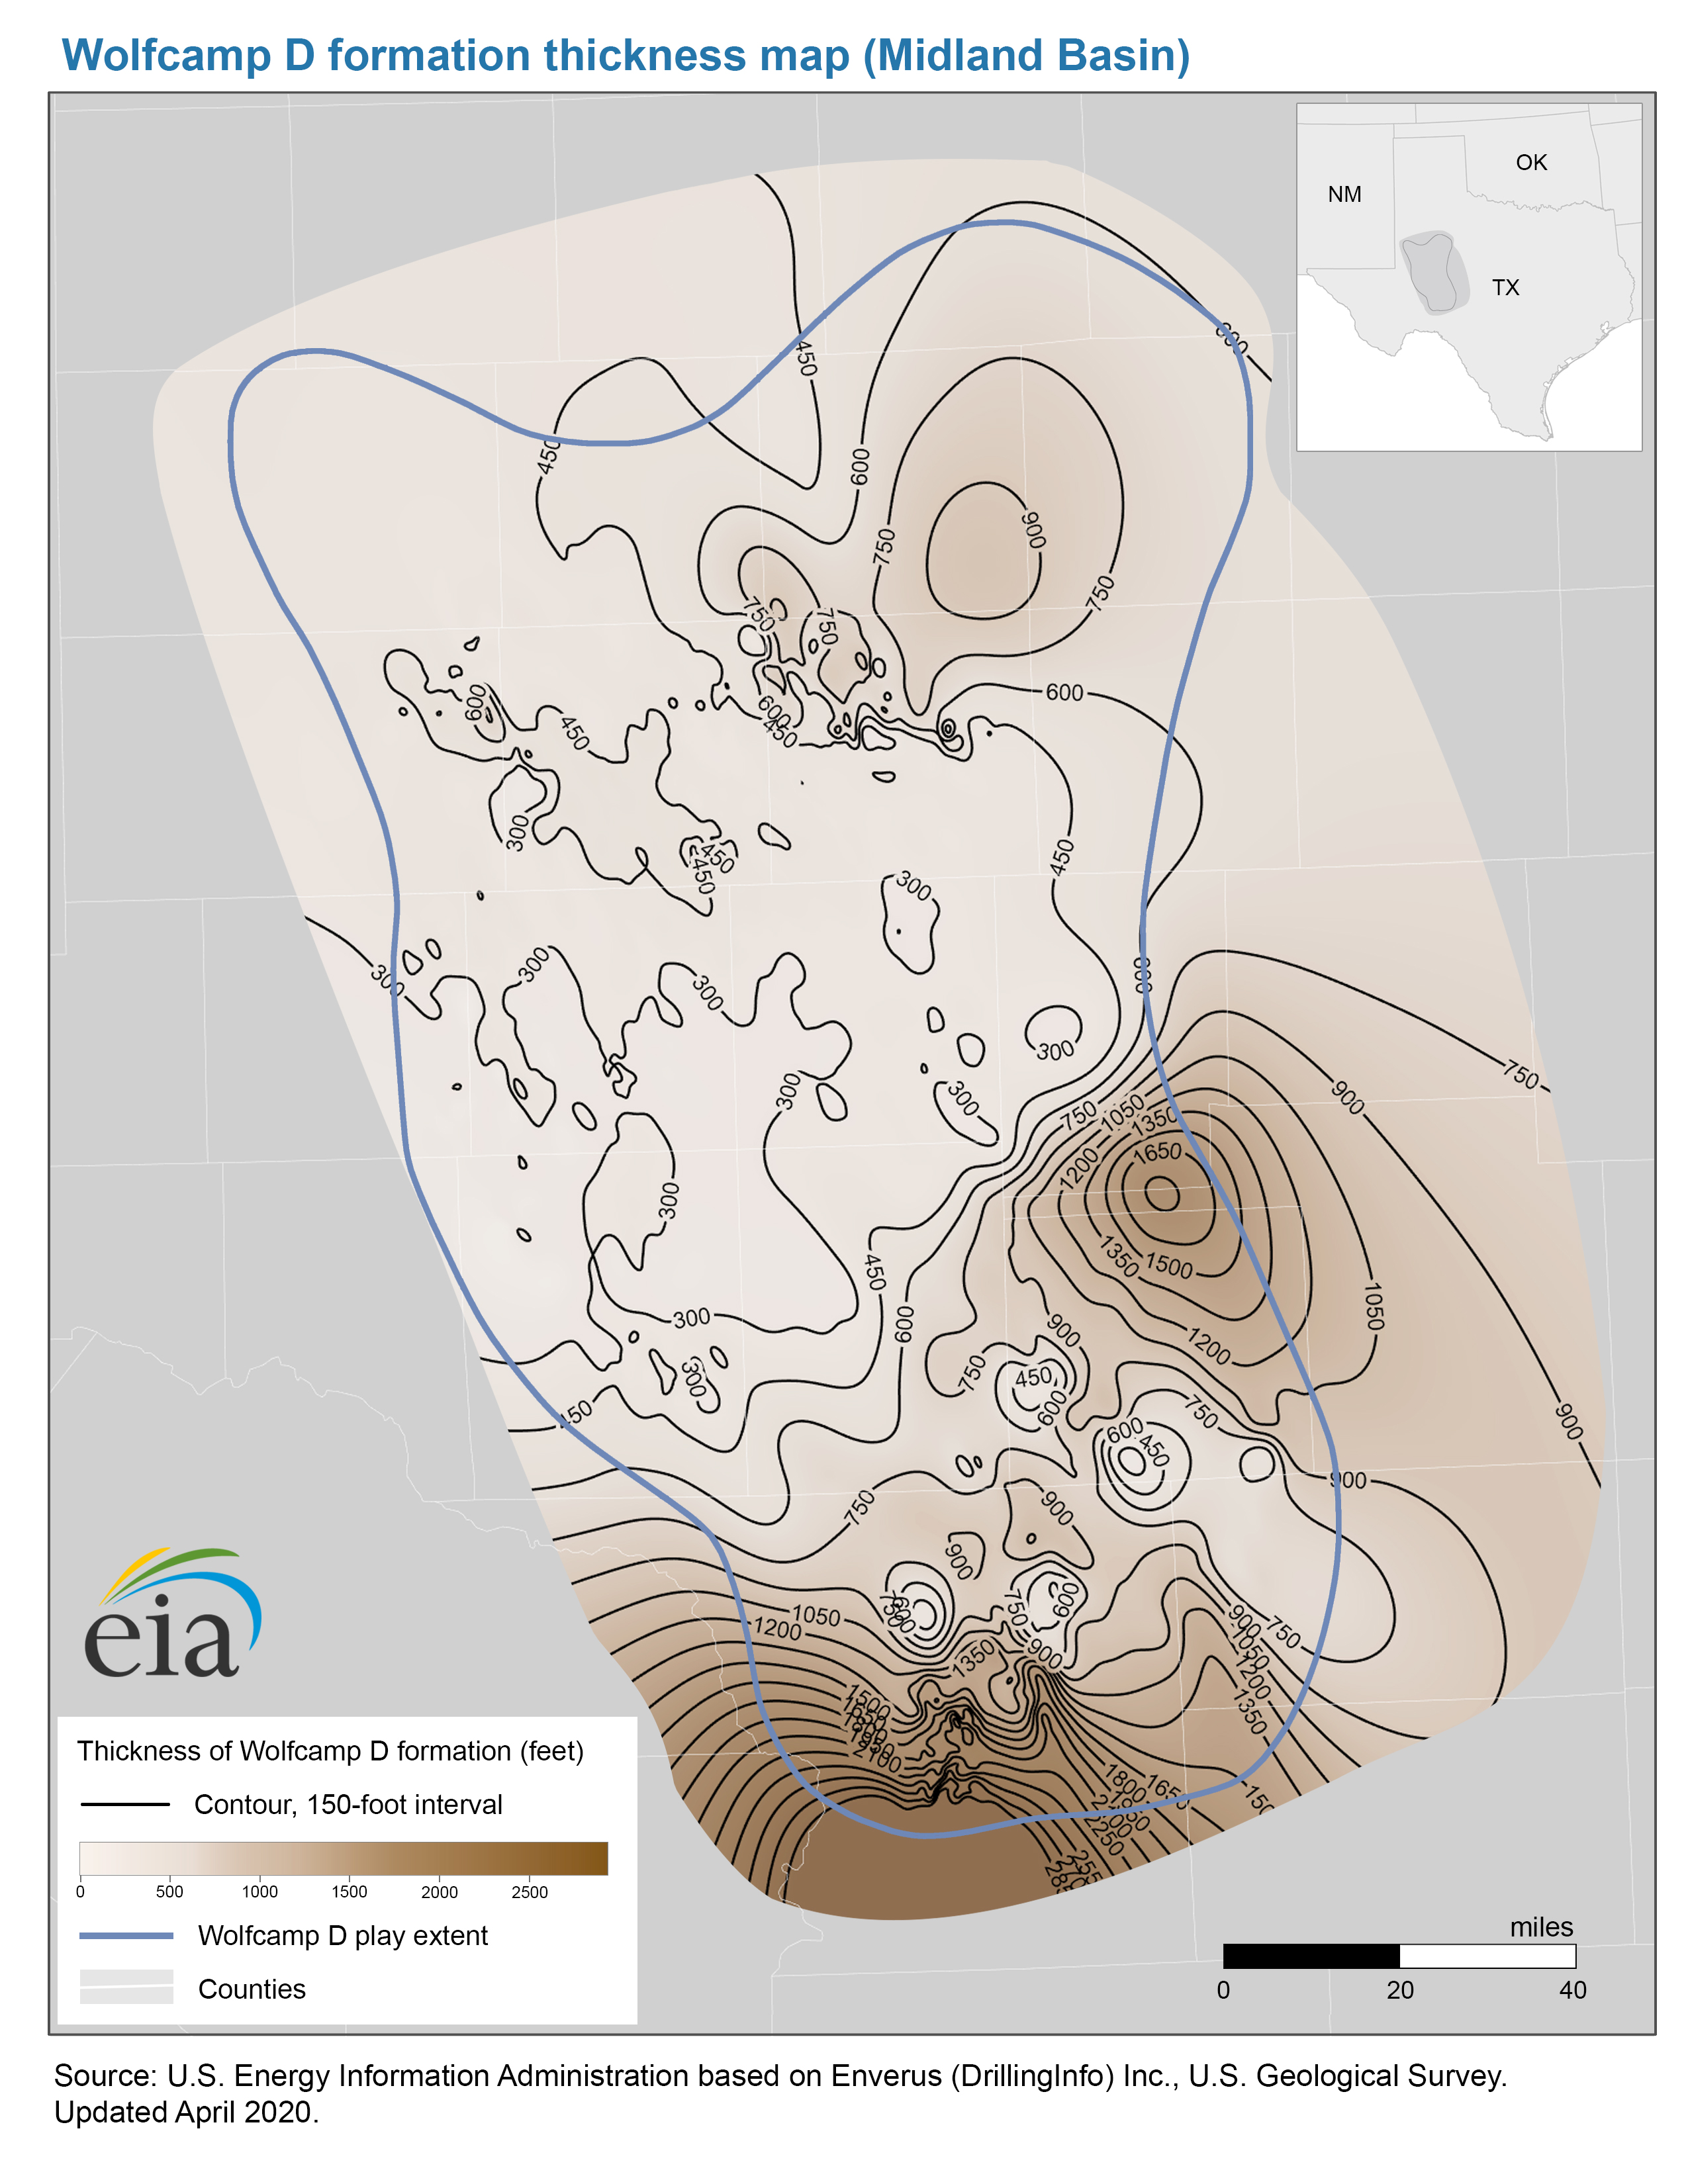
- Thickness map of the Wolfcamp D formation, Midland Basin (4/23/2020) PDF JPG
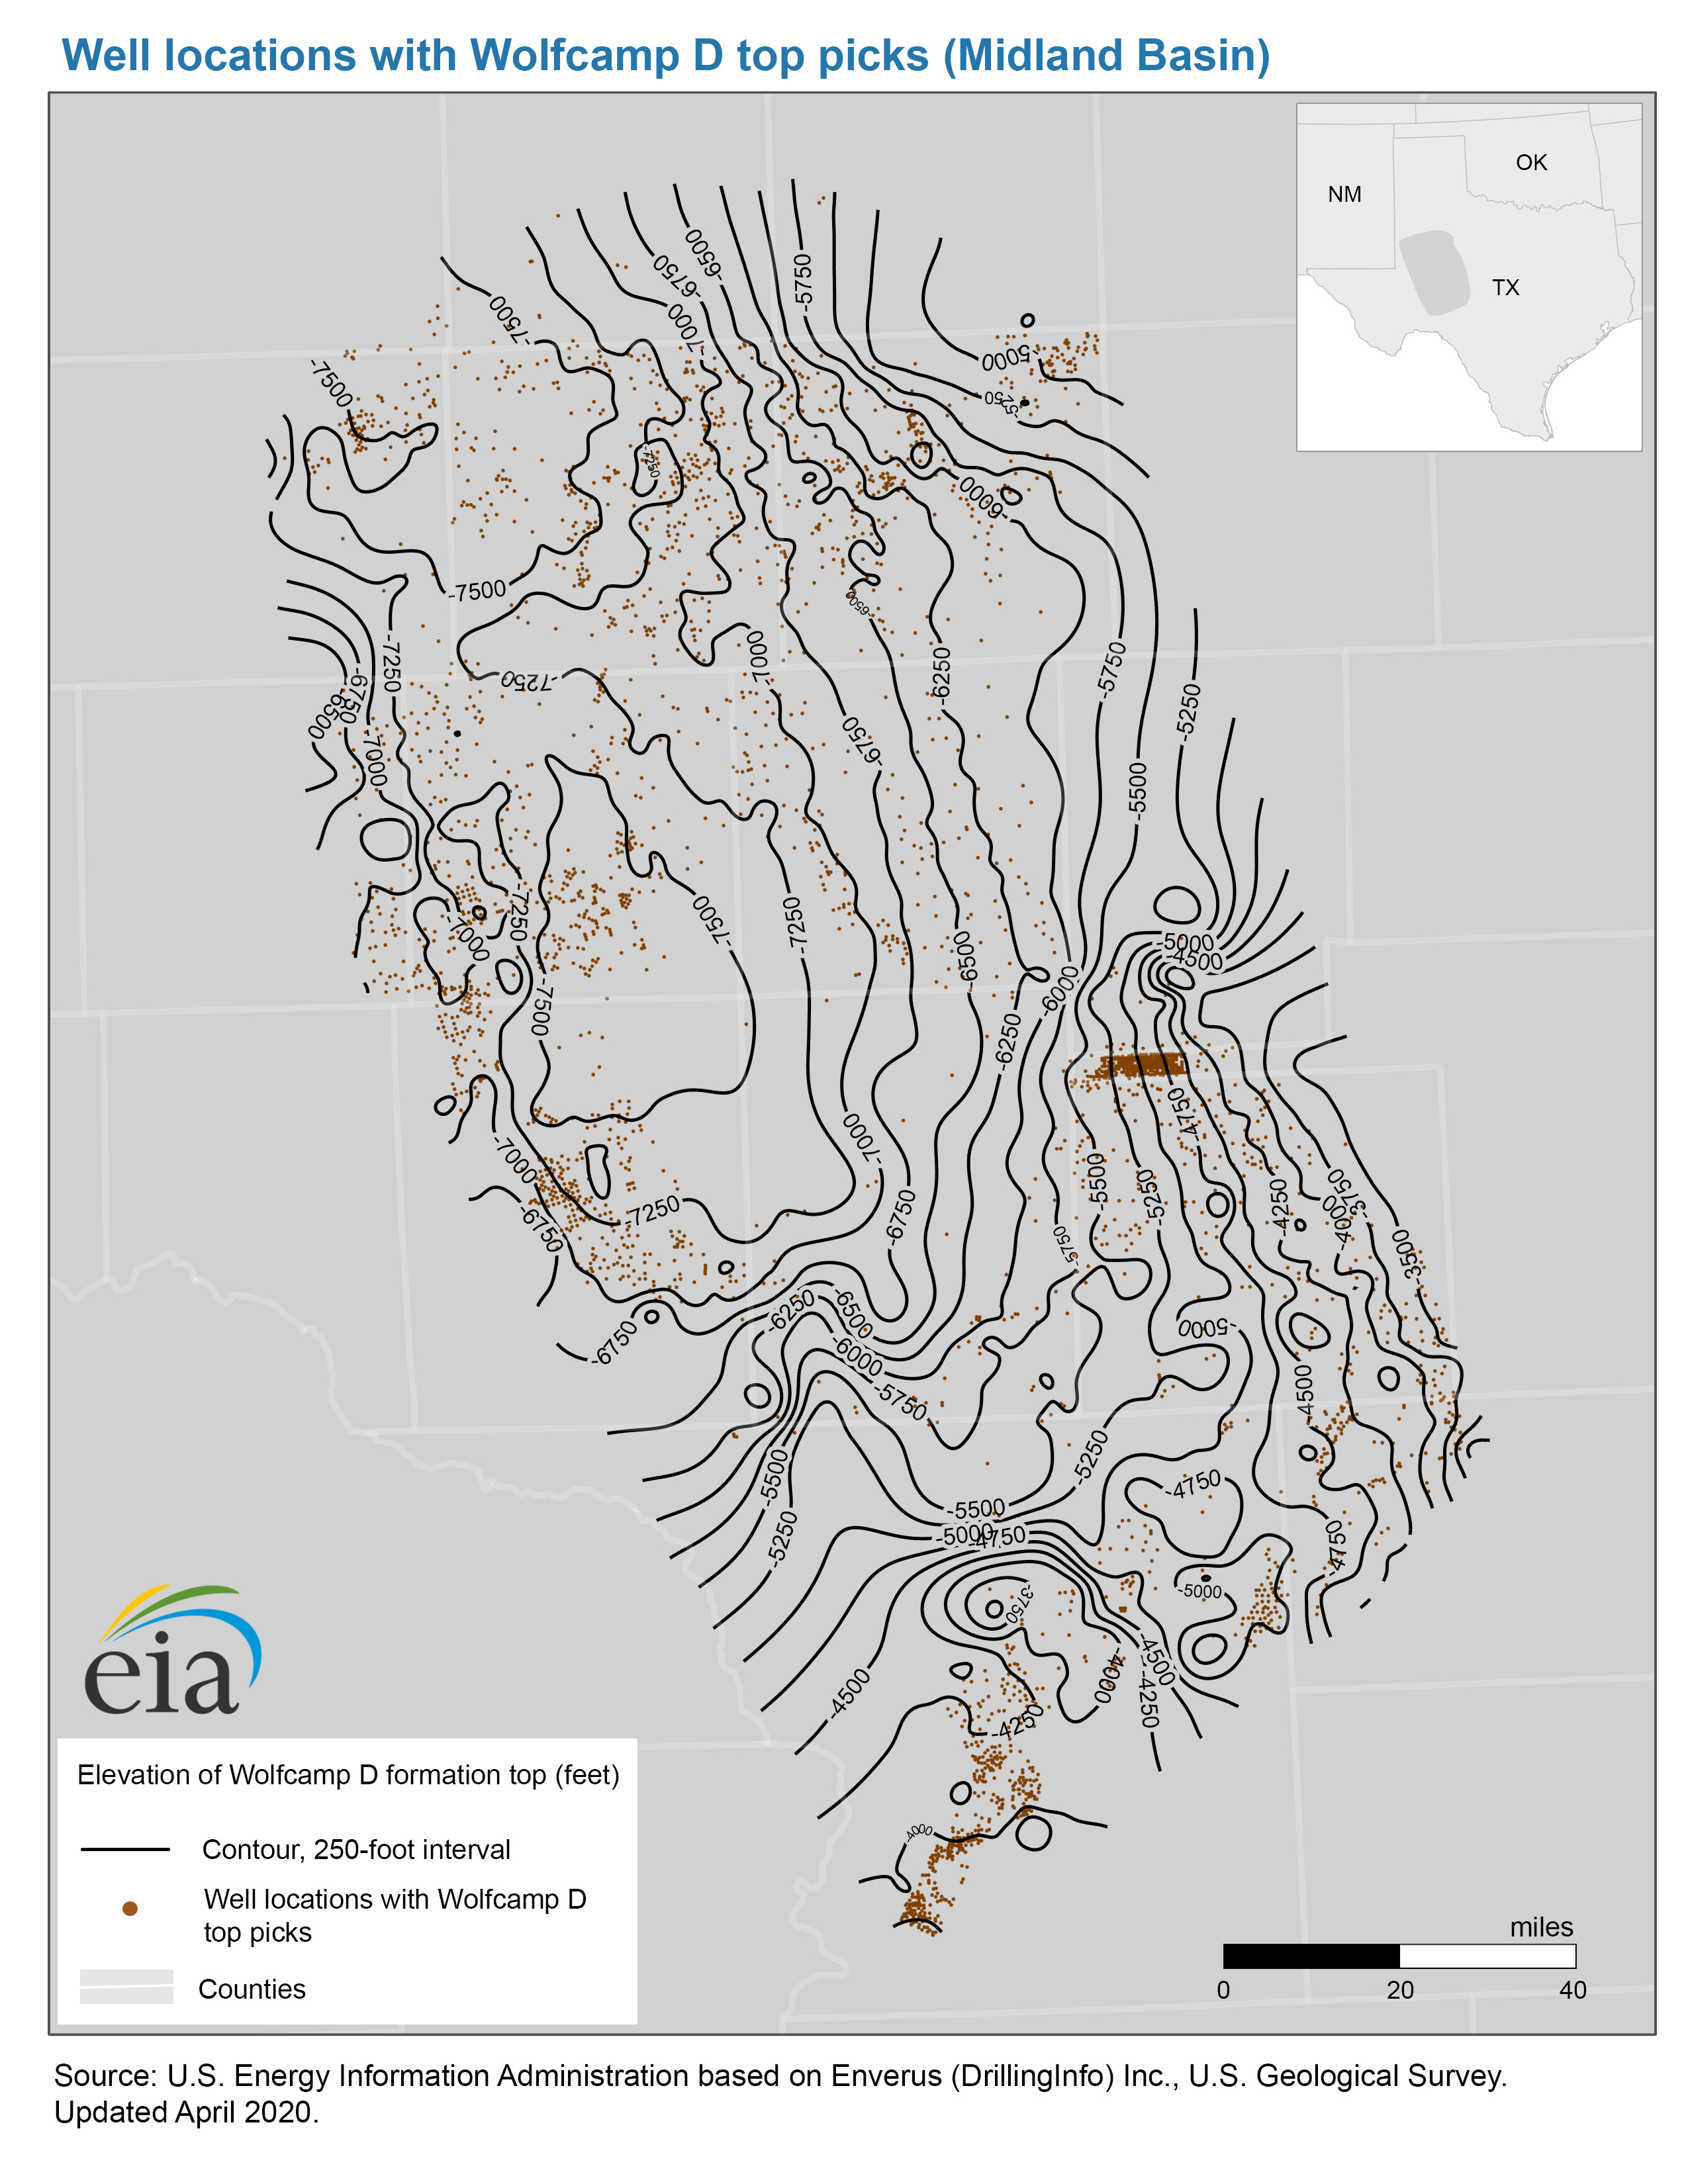
- Well locations with Wolfcamp D top picks map, Midland Basin (10/8/2020) PDF JPG
Map data
- Wolfcamp A formation structure and isopachs, Delaware Basin (9/4/2018) Shapefile
- Wolfcamp B formation structure and isopachs, Delaware Basin (11/29/2018) Shapefile
- Wolfcamp A, B, C, and D formation structure and isopachs, Midland Basin (4/23/2020) Shapefile
- Wolfcamp A, B, C, and D play boundaries, Midland Basin (6/4/2020) Shapefile
Spraberry formation benches
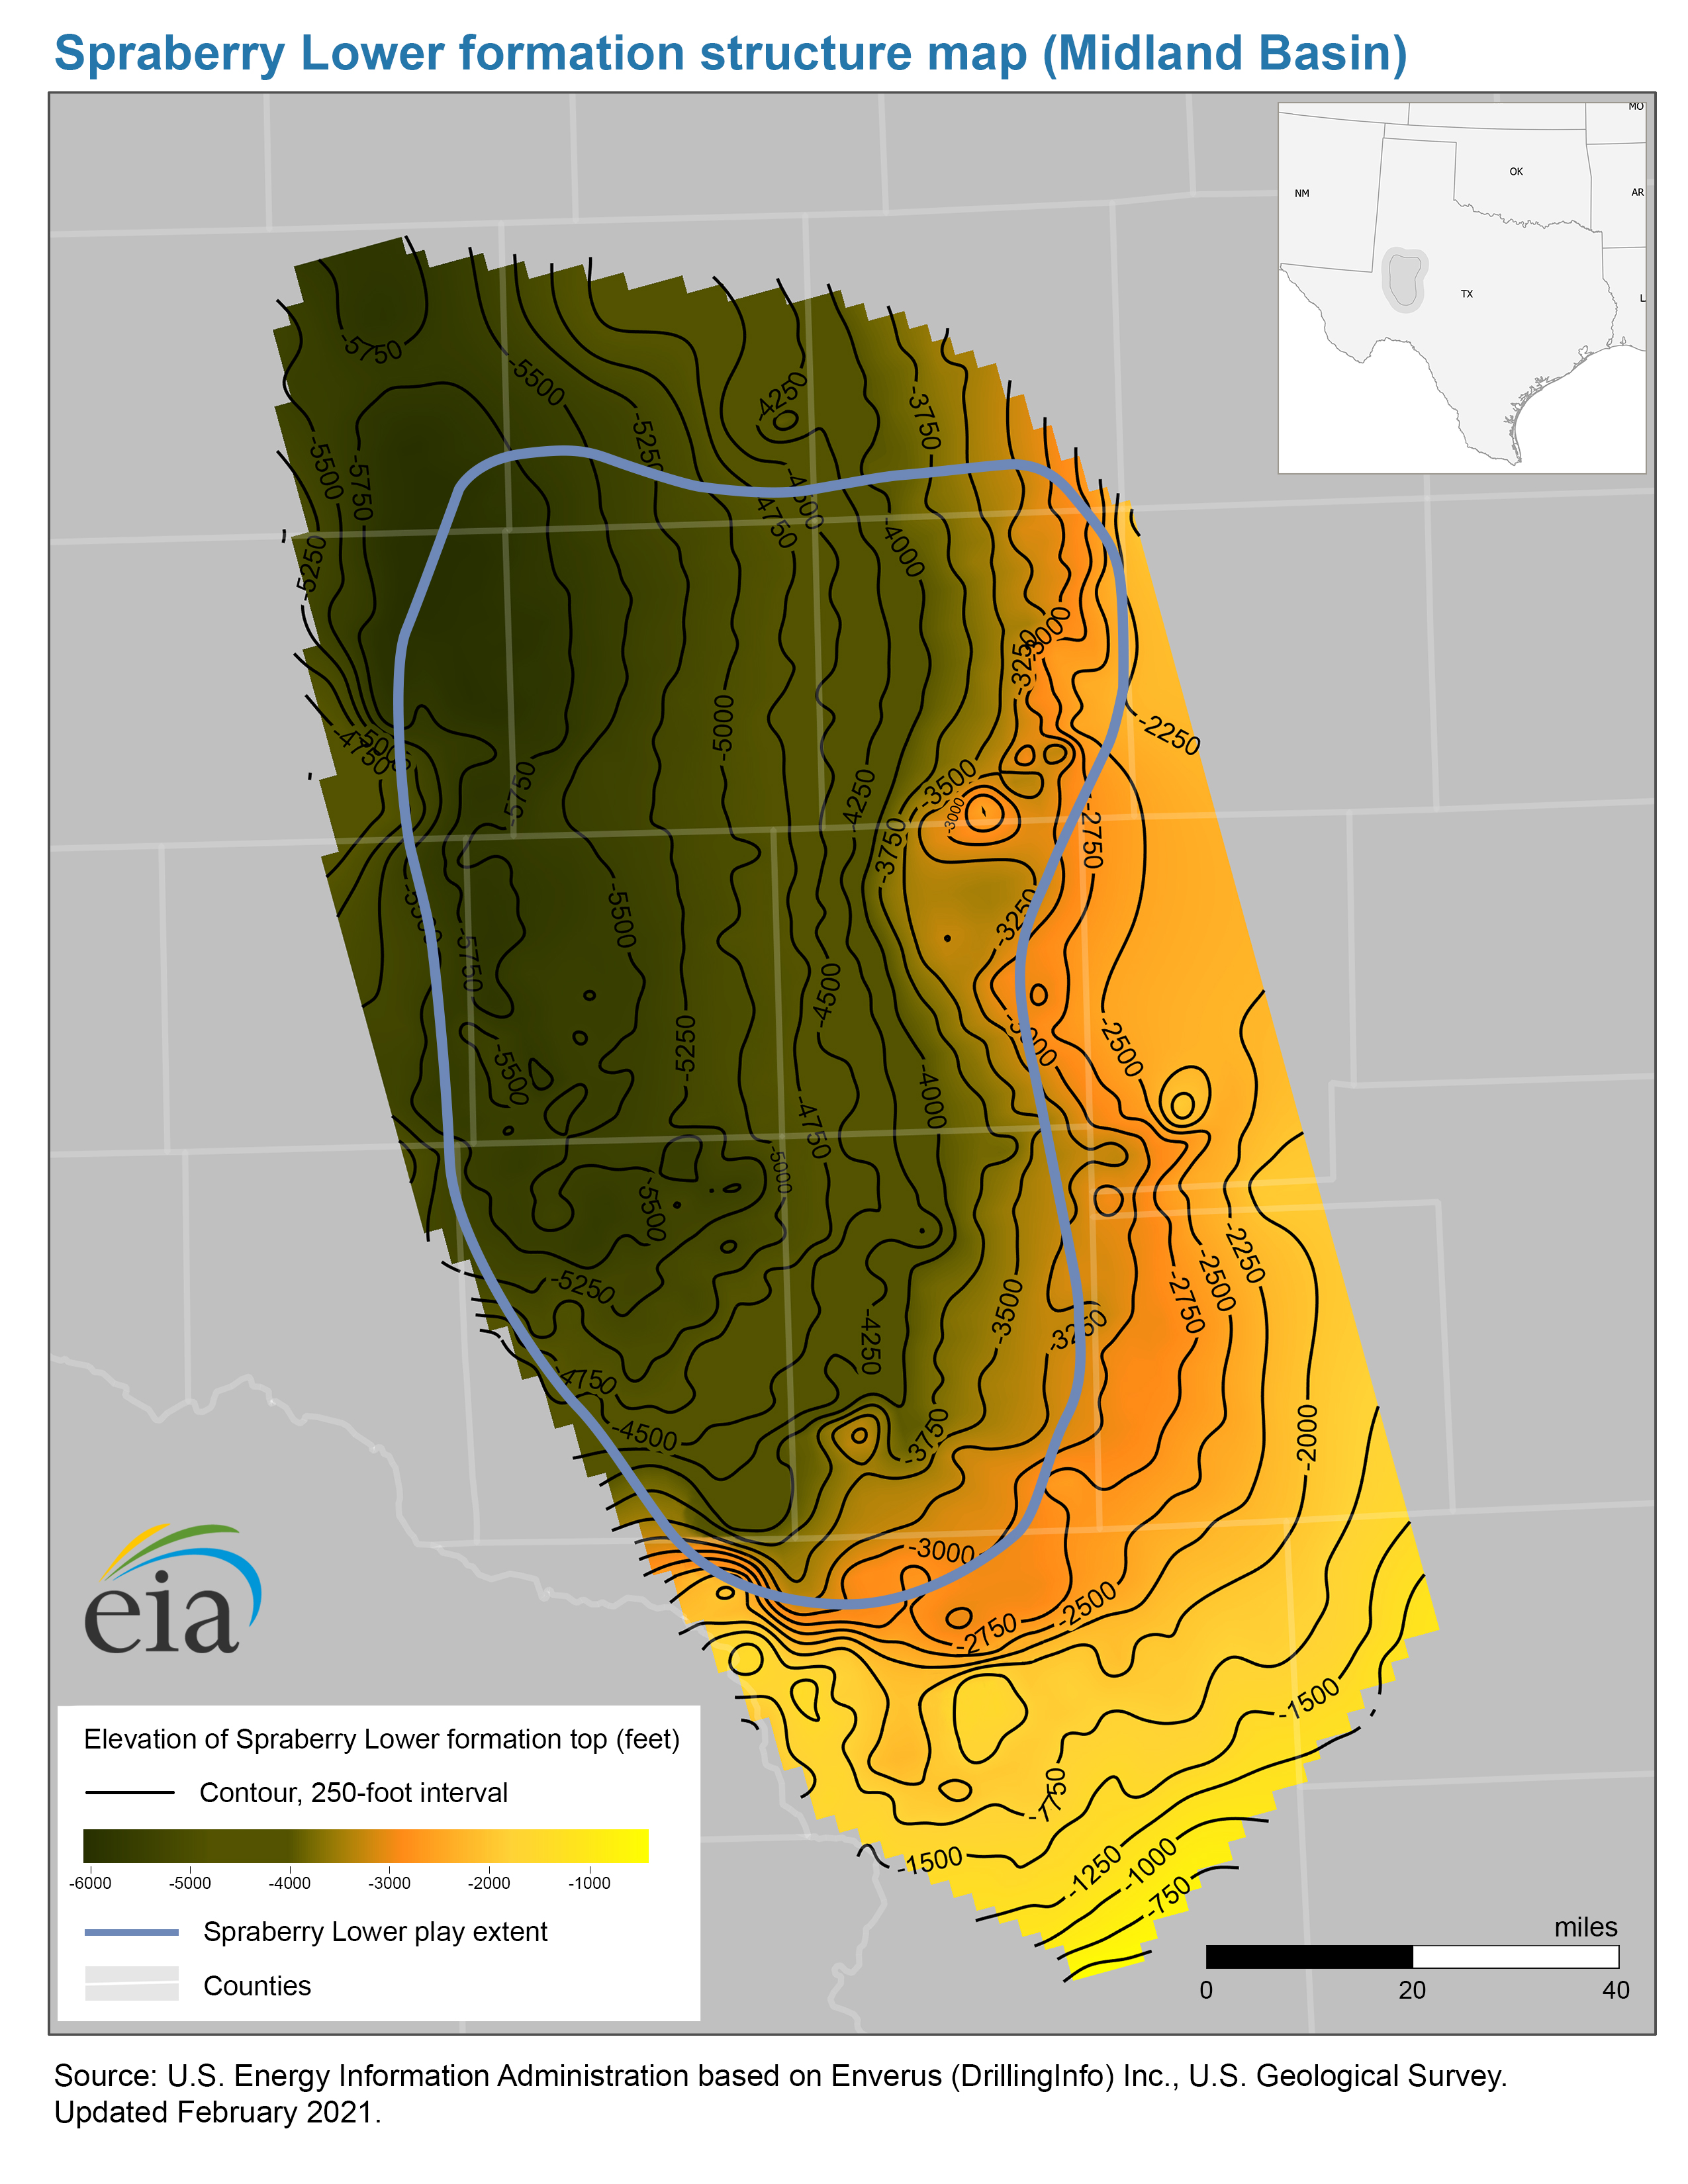
- Structure map of the Spraberry Lower formation, Midland Basin (2/13/2020) PDF JPG
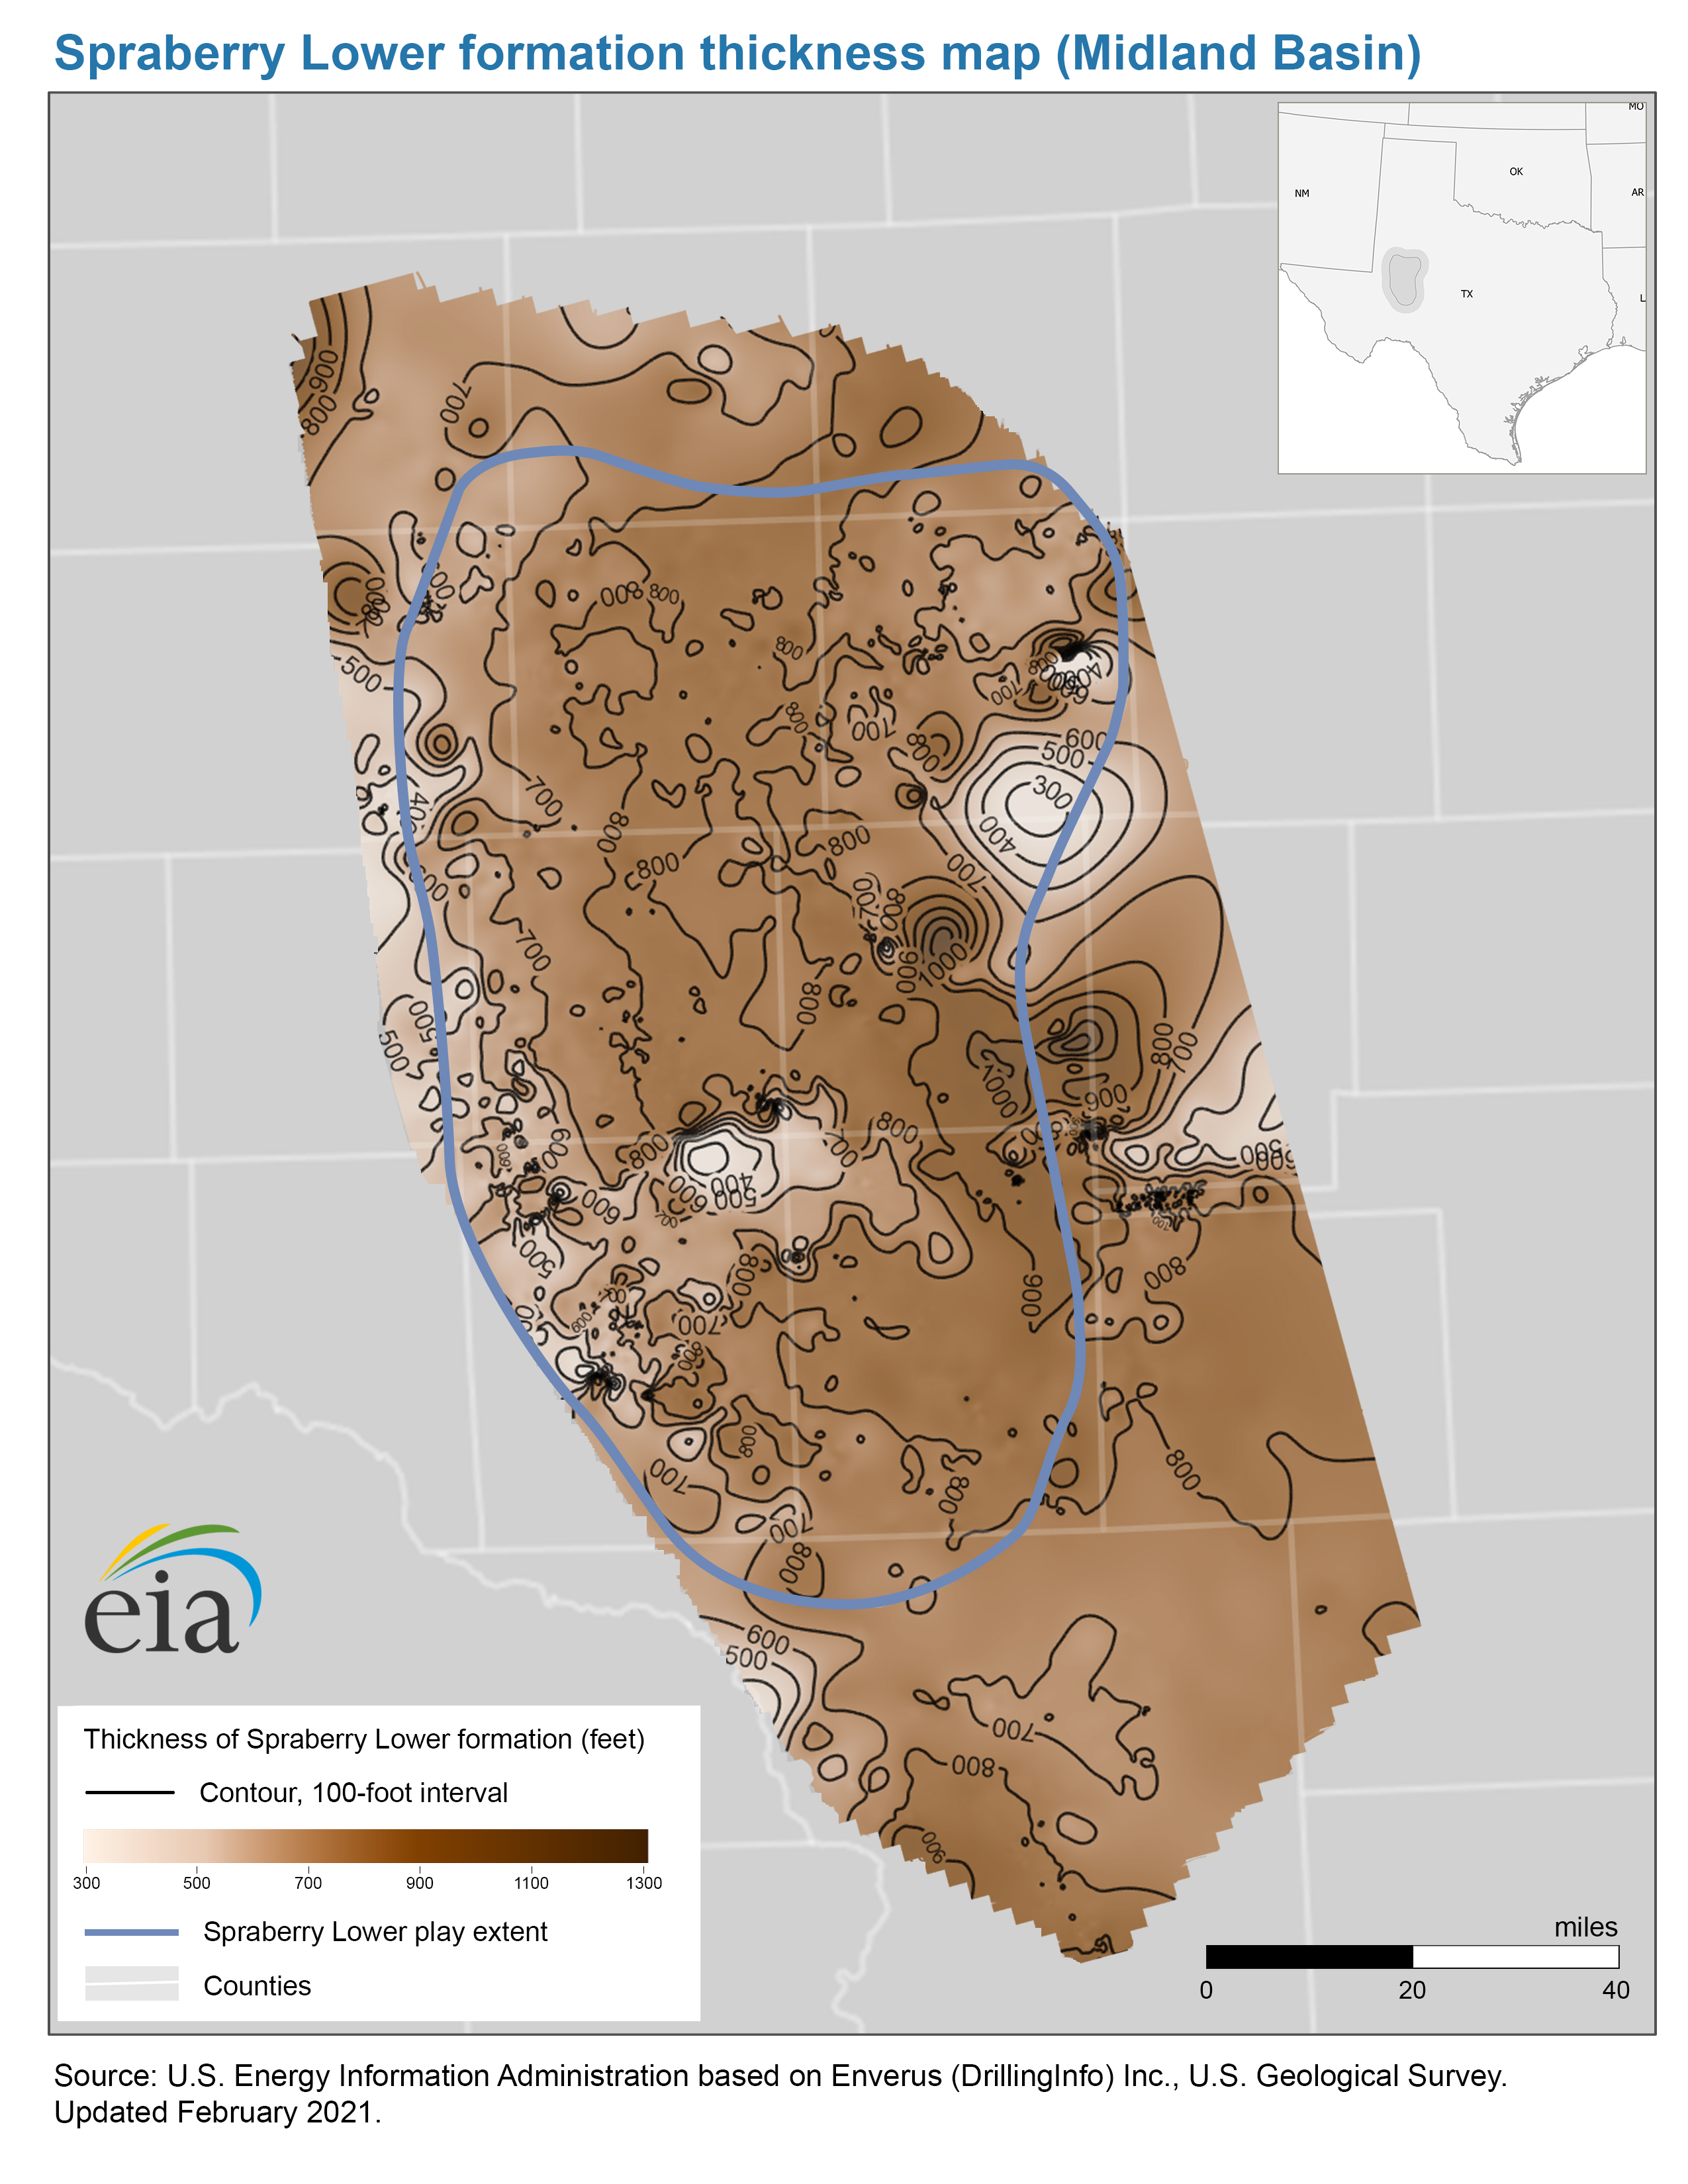
- Thickness map of the Spraberry Lower formation, Midland Basin (2/13/2020) PDF JPG
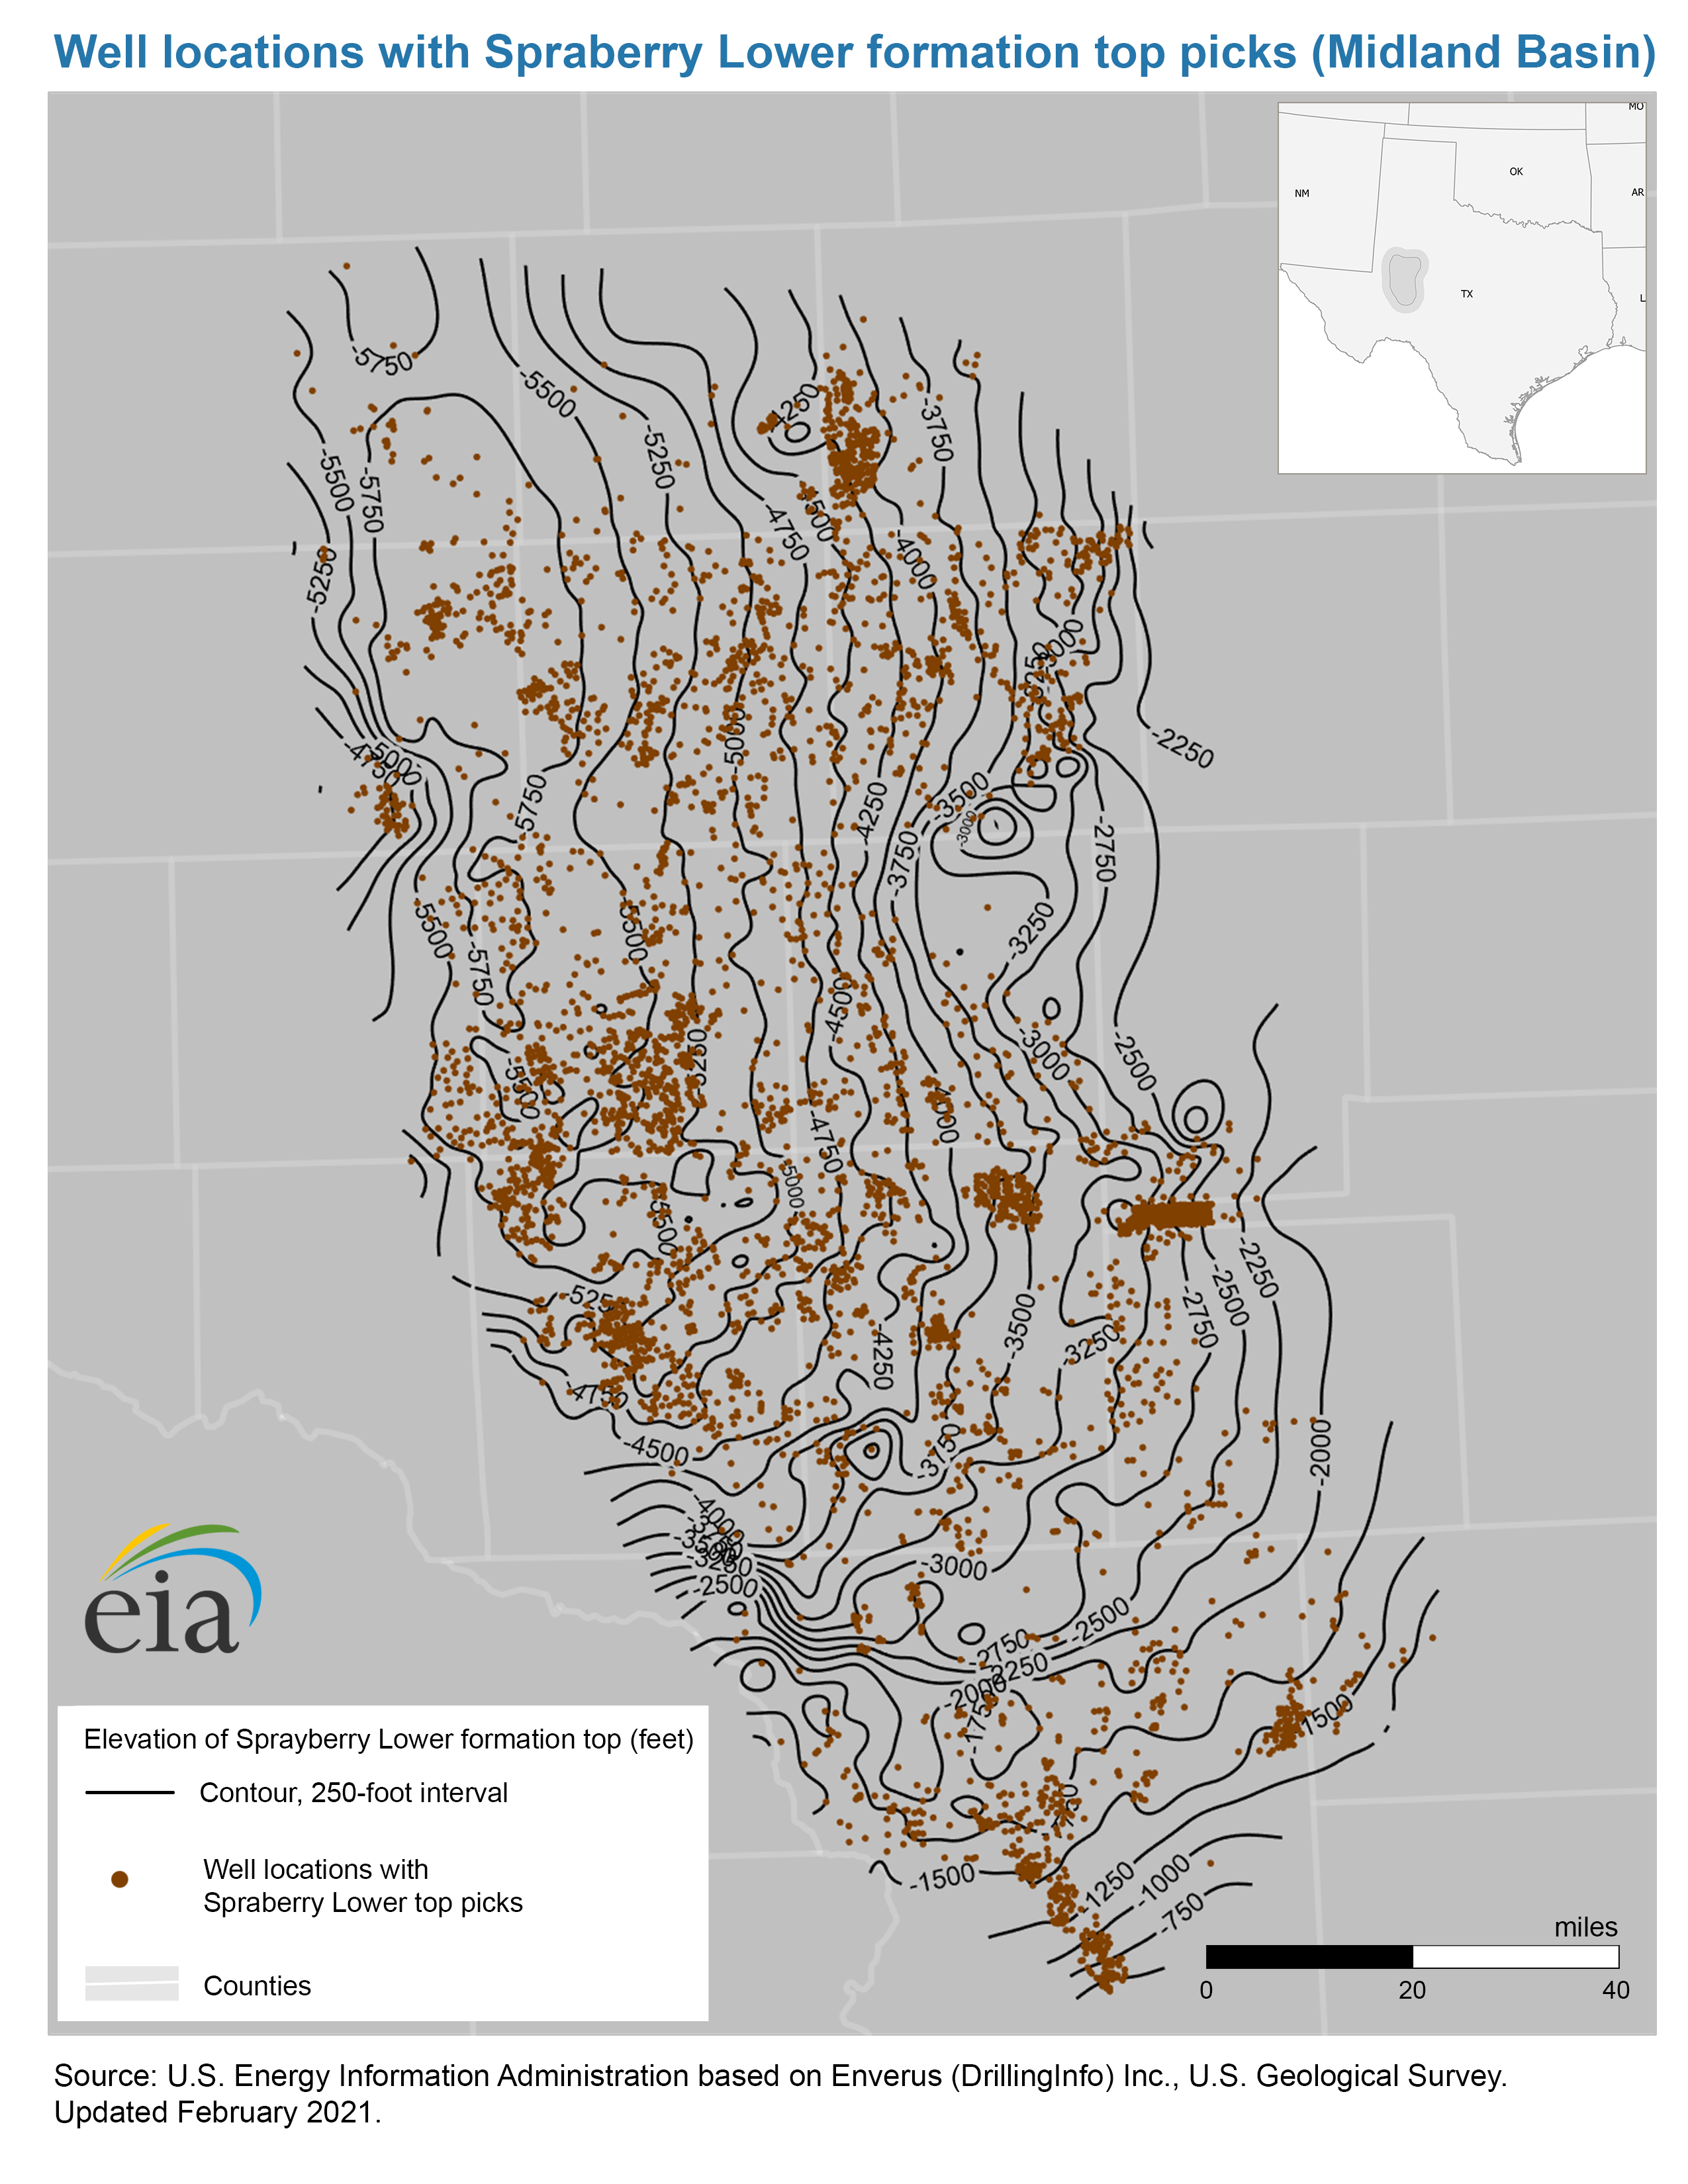
- Well locations with Spraberry Lower top picks map, Midland Basin (2/13/2020) PDF JPG
Map data
- Spraberry Lower formation structure and isopachs, Midland Basin (3/5/2021) Shapefile
- Spraberry Lower play boundaries, Midland Basin (3/5/2021) Shapefile
|
Rocky Mountain Sedimentary System (Basins: Denver, Greater Green River, Park, Powder River)
Map data
- Niobrara play boundaries, structure and isopachs (3/11/2016) Shapefile
|
Texas-Louisiana Salt Basin
- Haynesville-Bossier Shale Play (6/1/2011) PDF
|
Western Gulf Basin, South Texas
- Eagle Ford Play Report: geology review and map updates (12/29/2014) PDF
- Eagle Ford Shale Play (12/29/2014) PDF
- History animation: Eagle Ford shale production, 2006-2010 (9/30/2011) ZIP
Map data
- Eagle Ford play boundaries, structure and isopachs (3/11/2016) Shapefile
|
Williston Basin
- Bakken Shale Play, North Dakota, Montana, Saskatchewan & Manitoba (3/20/2011) PDF
- History animation: Bakken shale production, 1985-2010 (9/30/2011) ZIP
Map data
- Bakken and Three Forks play boundaries, structure and isopachs (3/11/2016) Shapefile
|
|
- Panel 1: Coalbed methane status map (large format 60"x36") (July 2007) PDF
- Panel 2: Coalbed Methane Past, Present, and Future (large format, 36" x 24") (Nov. 2007) PDF
Map data
- field boundaries (2007), resources (2006), reserves and production (2006), and top 100 methane emitting coal mines (2005) Shapefile
|
|
The following national map portrays the location of fields identified as being among the 100 largest oil and/or 100 largest gas fields in the U.S. on December 31, 2009.
|
| The 100 Volumetrically Largest U.S. Oil and Gas Fields (12/7/2010) |
The following letter size maps portray the same information by product.
|
| Top 100 U.S. Oil Fields By 2009 Proved Reserves (12/7/2010) |
| Top 100 U.S. Gas Fields By 2009 Proved Reserves (12/7/2010) |
|
The detailed field maps linked below portray the locations, boundaries, names, and either the barrel-of-oil equivalent (BOE) or the liquid hydrocarbon (crude oil plus lease condensate) or the natural gas reserve size classes of the known oil and gas fields in selected geologically defined areas of the U.S. at year-end 2001. Multiple map sheets were required to adequately portray the fields of some areas. Use this
Index of Detailed Field Maps to identify which of the subsequently listed oil and gas field maps you might be interested in viewing. Pursuant to Section 604 of the Energy Policy and Conservation Act, these maps are one product of a joint Department of the Interior, Department of Energy, and Department of Agriculture study of access to oil and gas resources located on Federal onshore lands. The maps conform to that ongoing study's temporal, areal, and technical requirements.
Note that most of the maps are large format (60 inches X 36 inches, for example) and are intended for printing on a wide-bed printer. To clearly view them on your monitor you will have to zoom in and then scroll through the map.
|
|
|
| Powder River, Greater Green River, Uinta-Piceance, and Paradox-San Juan Basins plus Shapefile for the Montana Thrust Belt |
| Appalachian Basin |
| Black Warrior Basin, Denver Basin, Wyoming Thrust Belt, National Petroleum Reserve-Alaska plus the Arctic National Wildlife Refuge 1002 Area, and the South Florida Peninsula |
| Eastern Great Basin, Eastern Oregon and Washington, Alaskan North Slope, Alaska's Cook Inlet, Ventura Basin, and Williston Basin |
|
|
The following Word® (.doc) files provide and describe three script codes conceived, developed, and implemented by EIA to (a) automatically and efficiently generate geologically reasonable oil and gas field boundaries from well data, and then (b) calculate the percentage of Federal land within the each field's boundary. The scripts are coded in Visual Basic® for use in conjunction with ArcGIS® software. |
|
| Well Buffering Script |
|
| Field Outline Smoothing Script | Tool (6/1/2011 for ArcGIS 10.0) |
|
| Federal Land Percentage Calculation Script |
|
| Application of the decision procedure specified in the Federal Geographic Data Committee's Guidelines for Providing Appropriate Access to Geospatial Data in Response to Security Concerns to the geospatial data provided via this web page resulted in a finding that safeguarding of these data is unwarranted. |
|
| Adobe Reader is a trademark of Adobe Systems Incorporated; Word and Visual Basic are trademarks of Microsoft Corporation; ArcGIS is a trademark of ESRI, Inc.; WinZip is a trademark of WinZip International LLC. |
|