|
Download Data (XLS File) |
|
||||||||
|
||||||||
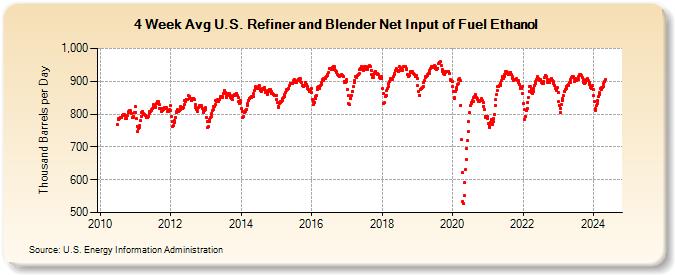
| 4-Week Avg U.S. Refiner and Blender Net Input of Fuel Ethanol (Thousand Barrels per Day) | ||||||||
| Year-Month | Week 1 | Week 2 | Week 3 | Week 4 | Week 5 | |||||||
|---|---|---|---|---|---|---|---|---|---|---|---|---|
| End Date | Value | End Date | Value | End Date | Value | End Date | Value | End Date | Value | |||
| 2010-Jun | 06/04 | - | 06/11 | - | 06/18 | - | 06/25 | 768 | ||||
| 2010-Jul | 07/02 | 782 | 07/09 | 787 | 07/16 | 787 | 07/23 | 791 | 07/30 | 788 | ||
| 2010-Aug | 08/06 | 790 | 08/13 | 795 | 08/20 | 797 | 08/27 | 798 | ||||
| 2010-Sep | 09/03 | 799 | 09/10 | 795 | 09/17 | 785 | 09/24 | 786 | ||||
| 2010-Oct | 10/01 | 785 | 10/08 | 795 | 10/15 | 805 | 10/22 | 809 | 10/29 | 811 | ||
| 2010-Nov | 11/05 | 810 | 11/12 | 807 | 11/19 | 803 | 11/26 | 791 | ||||
| 2010-Dec | 12/03 | 791 | 12/10 | 794 | 12/17 | 806 | 12/24 | 823 | 12/31 | 805 | ||
| 2011-Jan | 01/07 | 785 | 01/14 | 763 | 01/21 | 747 | 01/28 | 755 | ||||
| 2011-Feb | 02/04 | 759 | 02/11 | 764 | 02/18 | 780 | 02/25 | 793 | ||||
| 2011-Mar | 03/04 | 804 | 03/11 | 808 | 03/18 | 803 | 03/25 | 800 | ||||
| 2011-Apr | 04/01 | 798 | 04/08 | 797 | 04/15 | 796 | 04/22 | 788 | 04/29 | 791 | ||
| 2011-May | 05/06 | 791 | 05/13 | 794 | 05/20 | 801 | 05/27 | 807 | ||||
| 2011-Jun | 06/03 | 807 | 06/10 | 811 | 06/17 | 815 | 06/24 | 817 | ||||
| 2011-Jul | 07/01 | 829 | 07/08 | 823 | 07/15 | 823 | 07/22 | 822 | 07/29 | 821 | ||
| 2011-Aug | 08/05 | 832 | 08/12 | 838 | 08/19 | 836 | 08/26 | 838 | ||||
| 2011-Sep | 09/02 | 829 | 09/09 | 818 | 09/16 | 816 | 09/23 | 809 | 09/30 | 811 | ||
| 2011-Oct | 10/07 | 816 | 10/14 | 814 | 10/21 | 817 | 10/28 | 820 | ||||
| 2011-Nov | 11/04 | 817 | 11/11 | 819 | 11/18 | 818 | 11/25 | 809 | ||||
| 2011-Dec | 12/02 | 809 | 12/09 | 809 | 12/16 | 814 | 12/23 | 825 | 12/30 | 812 | ||
| 2012-Jan | 01/06 | 793 | 01/13 | 777 | 01/20 | 761 | 01/27 | 765 | ||||
| 2012-Feb | 02/03 | 774 | 02/10 | 781 | 02/17 | 791 | 02/24 | 804 | ||||
| 2012-Mar | 03/02 | 808 | 03/09 | 814 | 03/16 | 811 | 03/23 | 807 | 03/30 | 811 | ||
| 2012-Apr | 04/06 | 813 | 04/13 | 822 | 04/20 | 820 | 04/27 | 818 | ||||
| 2012-May | 05/04 | 818 | 05/11 | 819 | 05/18 | 829 | 05/25 | 841 | ||||
| 2012-Jun | 06/01 | 839 | 06/08 | 845 | 06/15 | 844 | 06/22 | 844 | 06/29 | 855 | ||
| 2012-Jul | 07/06 | 852 | 07/13 | 850 | 07/20 | 846 | 07/27 | 842 | ||||
| 2012-Aug | 08/03 | 842 | 08/10 | 846 | 08/17 | 846 | 08/24 | 847 | 08/31 | 843 | ||
| 2012-Sep | 09/07 | 828 | 09/14 | 821 | 09/21 | 814 | 09/28 | 809 | ||||
| 2012-Oct | 10/05 | 818 | 10/12 | 819 | 10/19 | 823 | 10/26 | 825 | ||||
| 2012-Nov | 11/02 | 825 | 11/09 | 827 | 11/16 | 822 | 11/23 | 817 | 11/30 | 812 | ||
| 2012-Dec | 12/07 | 806 | 12/14 | 810 | 12/21 | 819 | 12/28 | 813 | ||||
| 2013-Jan | 01/04 | 791 | 01/11 | 778 | 01/18 | 760 | 01/25 | 761 | ||||
| 2013-Feb | 02/01 | 777 | 02/08 | 782 | 02/15 | 788 | 02/22 | 794 | ||||
| 2013-Mar | 03/01 | 803 | 03/08 | 811 | 03/15 | 814 | 03/22 | 822 | 03/29 | 824 | ||
| 2013-Apr | 04/05 | 829 | 04/12 | 840 | 04/19 | 838 | 04/26 | 843 | ||||
| 2013-May | 05/03 | 841 | 05/10 | 839 | 05/17 | 845 | 05/24 | 852 | 05/31 | 850 | ||
| 2013-Jun | 06/07 | 854 | 06/14 | 852 | 06/21 | 850 | 06/28 | 864 | ||||
| 2013-Jul | 07/05 | 873 | 07/12 | 867 | 07/19 | 865 | 07/26 | 858 | ||||
| 2013-Aug | 08/02 | 850 | 08/09 | 858 | 08/16 | 862 | 08/23 | 864 | 08/30 | 863 | ||
| 2013-Sep | 09/06 | 857 | 09/13 | 851 | 09/20 | 847 | 09/27 | 843 | ||||
| 2013-Oct | 10/04 | 852 | 10/11 | 856 | 10/18 | 855 | 10/25 | 861 | ||||
| 2013-Nov | 11/01 | 859 | 11/08 | 863 | 11/15 | 864 | 11/22 | 856 | 11/29 | 850 | ||
| 2013-Dec | 12/06 | 838 | 12/13 | 832 | 12/20 | 841 | 12/27 | 834 | ||||
| 2014-Jan | 01/03 | 817 | 01/10 | 809 | 01/17 | 791 | 01/24 | 792 | 01/31 | 804 | ||
| 2014-Feb | 02/07 | 808 | 02/14 | 810 | 02/21 | 815 | 02/28 | 826 | ||||
| 2014-Mar | 03/07 | 832 | 03/14 | 842 | 03/21 | 847 | 03/28 | 848 | ||||
| 2014-Apr | 04/04 | 851 | 04/11 | 852 | 04/18 | 851 | 04/25 | 854 | ||||
| 2014-May | 05/02 | 853 | 05/09 | 863 | 05/16 | 872 | 05/23 | 879 | 05/30 | 883 | ||
| 2014-Jun | 06/06 | 878 | 06/13 | 879 | 06/20 | 878 | 06/27 | 884 | ||||
| 2014-Jul | 07/04 | 887 | 07/11 | 877 | 07/18 | 872 | 07/25 | 871 | ||||
| 2014-Aug | 08/01 | 869 | 08/08 | 878 | 08/15 | 876 | 08/22 | 879 | 08/29 | 881 | ||
| 2014-Sep | 09/05 | 871 | 09/12 | 866 | 09/19 | 866 | 09/26 | 861 | ||||
| 2014-Oct | 10/03 | 863 | 10/10 | 873 | 10/17 | 870 | 10/24 | 874 | 10/31 | 875 | ||
| 2014-Nov | 11/07 | 869 | 11/14 | 863 | 11/21 | 862 | 11/28 | 861 | ||||
| 2014-Dec | 12/05 | 856 | 12/12 | 856 | 12/19 | 858 | 12/26 | 858 | ||||
| 2015-Jan | 01/02 | 845 | 01/09 | 835 | 01/16 | 824 | 01/23 | 821 | 01/30 | 831 | ||
| 2015-Feb | 02/06 | 834 | 02/13 | 838 | 02/20 | 838 | 02/27 | 842 | ||||
| 2015-Mar | 03/06 | 846 | 03/13 | 849 | 03/20 | 854 | 03/27 | 860 | ||||
| 2015-Apr | 04/03 | 866 | 04/10 | 872 | 04/17 | 875 | 04/24 | 876 | ||||
| 2015-May | 05/01 | 877 | 05/08 | 879 | 05/15 | 886 | 05/22 | 893 | 05/29 | 894 | ||
| 2015-Jun | 06/05 | 892 | 06/12 | 894 | 06/19 | 893 | 06/26 | 901 | ||||
| 2015-Jul | 07/03 | 906 | 07/10 | 899 | 07/17 | 897 | 07/24 | 896 | 07/31 | 898 | ||
| 2015-Aug | 08/07 | 902 | 08/14 | 905 | 08/21 | 905 | 08/28 | 907 | ||||
| 2015-Sep | 09/04 | 907 | 09/11 | 899 | 09/18 | 897 | 09/25 | 887 | ||||
| 2015-Oct | 10/02 | 883 | 10/09 | 885 | 10/16 | 887 | 10/23 | 895 | 10/30 | 896 | ||
| 2015-Nov | 11/06 | 891 | 11/13 | 884 | 11/20 | 877 | 11/27 | 875 | ||||
| 2015-Dec | 12/04 | 868 | 12/11 | 873 | 12/18 | 871 | 12/25 | 879 | ||||
| 2016-Jan | 01/01 | 866 | 01/08 | 845 | 01/15 | 839 | 01/22 | 829 | 01/29 | 836 | ||
| 2016-Feb | 02/05 | 848 | 02/12 | 854 | 02/19 | 858 | 02/26 | 875 | ||||
| 2016-Mar | 03/04 | 880 | 03/11 | 883 | 03/18 | 879 | 03/25 | 881 | ||||
| 2016-Apr | 04/01 | 886 | 04/08 | 891 | 04/15 | 897 | 04/22 | 904 | 04/29 | 907 | ||
| 2016-May | 05/06 | 903 | 05/13 | 909 | 05/20 | 908 | 05/27 | 912 | ||||
| 2016-Jun | 06/03 | 915 | 06/10 | 916 | 06/17 | 919 | 06/24 | 926 | ||||
| 2016-Jul | 07/01 | 940 | 07/08 | 939 | 07/15 | 940 | 07/22 | 937 | 07/29 | 935 | ||
| 2016-Aug | 08/05 | 943 | 08/12 | 945 | 08/19 | 944 | 08/26 | 938 | ||||
| 2016-Sep | 09/02 | 934 | 09/09 | 929 | 09/16 | 926 | 09/23 | 921 | 09/30 | 917 | ||
| 2016-Oct | 10/07 | 916 | 10/14 | 914 | 10/21 | 917 | 10/28 | 918 | ||||
| 2016-Nov | 11/04 | 920 | 11/11 | 917 | 11/18 | 917 | 11/25 | 913 | ||||
| 2016-Dec | 12/02 | 900 | 12/09 | 897 | 12/16 | 897 | 12/23 | 905 | 12/30 | 898 | ||
| 2017-Jan | 01/06 | 876 | 01/13 | 856 | 01/20 | 831 | 01/27 | 829 | ||||
| 2017-Feb | 02/03 | 846 | 02/10 | 848 | 02/17 | 857 | 02/24 | 868 | ||||
| 2017-Mar | 03/03 | 868 | 03/10 | 884 | 03/17 | 896 | 03/24 | 903 | 03/31 | 914 | ||
| 2017-Apr | 04/07 | 913 | 04/14 | 912 | 04/21 | 917 | 04/28 | 919 | ||||
| 2017-May | 05/05 | 925 | 05/12 | 935 | 05/19 | 939 | 05/26 | 944 | ||||
| 2017-Jun | 06/02 | 939 | 06/09 | 935 | 06/16 | 933 | 06/23 | 936 | 06/30 | 945 | ||
| 2017-Jul | 07/07 | 944 | 07/14 | 939 | 07/21 | 935 | 07/28 | 936 | ||||
| 2017-Aug | 08/04 | 939 | 08/11 | 946 | 08/18 | 946 | 08/25 | 948 | ||||
| 2017-Sep | 09/01 | 944 | 09/08 | 932 | 09/15 | 919 | 09/22 | 910 | 09/29 | 912 | ||
| 2017-Oct | 10/06 | 921 | 10/13 | 927 | 10/20 | 929 | 10/27 | 929 | ||||
| 2017-Nov | 11/03 | 924 | 11/10 | 923 | 11/17 | 922 | 11/24 | 920 | ||||
| 2017-Dec | 12/01 | 911 | 12/08 | 911 | 12/15 | 909 | 12/22 | 915 | 12/29 | 907 | ||
| 2018-Jan | 01/05 | 877 | 01/12 | 863 | 01/19 | 833 | 01/26 | 834 | ||||
| 2018-Feb | 02/02 | 852 | 02/09 | 858 | 02/16 | 873 | 02/23 | 878 | ||||
| 2018-Mar | 03/02 | 884 | 03/09 | 892 | 03/16 | 899 | 03/23 | 905 | 03/30 | 907 | ||
| 2018-Apr | 04/06 | 906 | 04/13 | 906 | 04/20 | 909 | 04/27 | 914 | ||||
| 2018-May | 05/04 | 919 | 05/11 | 925 | 05/18 | 933 | 05/25 | 938 | ||||
| 2018-Jun | 06/01 | 932 | 06/08 | 933 | 06/15 | 931 | 06/22 | 932 | 06/29 | 945 | ||
| 2018-Jul | 07/06 | 941 | 07/13 | 935 | 07/20 | 934 | 07/27 | 933 | ||||
| 2018-Aug | 08/03 | 936 | 08/10 | 944 | 08/17 | 945 | 08/24 | 946 | 08/31 | 946 | ||
| 2018-Sep | 09/07 | 938 | 09/14 | 935 | 09/21 | 922 | 09/28 | 916 | ||||
| 2018-Oct | 10/05 | 915 | 10/12 | 916 | 10/19 | 926 | 10/26 | 931 | ||||
| 2018-Nov | 11/02 | 931 | 11/09 | 930 | 11/16 | 927 | 11/23 | 924 | 11/30 | 919 | ||
| 2018-Dec | 12/07 | 915 | 12/14 | 913 | 12/21 | 916 | 12/28 | 909 | ||||
| 2019-Jan | 01/04 | 886 | 01/11 | 870 | 01/18 | 857 | 01/25 | 857 | ||||
| 2019-Feb | 02/01 | 875 | 02/08 | 878 | 02/15 | 879 | 02/22 | 882 | ||||
| 2019-Mar | 03/01 | 884 | 03/08 | 896 | 03/15 | 902 | 03/22 | 911 | 03/29 | 915 | ||
| 2019-Apr | 04/05 | 914 | 04/12 | 918 | 04/19 | 920 | 04/26 | 925 | ||||
| 2019-May | 05/03 | 925 | 05/10 | 932 | 05/17 | 938 | 05/24 | 943 | 05/31 | 946 | ||
| 2019-Jun | 06/07 | 946 | 06/14 | 943 | 06/21 | 944 | 06/28 | 948 | ||||
| 2019-Jul | 07/05 | 946 | 07/12 | 938 | 07/19 | 936 | 07/26 | 939 | ||||
| 2019-Aug | 08/02 | 939 | 08/09 | 953 | 08/16 | 958 | 08/23 | 957 | 08/30 | 959 | ||
| 2019-Sep | 09/06 | 949 | 09/13 | 936 | 09/20 | 931 | 09/27 | 924 | ||||
| 2019-Oct | 10/04 | 920 | 10/11 | 929 | 10/18 | 928 | 10/25 | 931 | ||||
| 2019-Nov | 11/01 | 931 | 11/08 | 930 | 11/15 | 931 | 11/22 | 929 | 11/29 | 925 | ||
| 2019-Dec | 12/06 | 905 | 12/13 | 901 | 12/20 | 903 | 12/27 | 898 | ||||
| 2020-Jan | 01/03 | 884 | 01/10 | 869 | 01/17 | 851 | 01/24 | 848 | 01/31 | 870 | ||
| 2020-Feb | 02/07 | 874 | 02/14 | 882 | 02/21 | 890 | 02/28 | 892 | ||||
| 2020-Mar | 03/06 | 904 | 03/13 | 908 | 03/20 | 901 | 03/27 | 827 | ||||
| 2020-Apr | 04/03 | 723 | 04/10 | 621 | 04/17 | 533 | 04/24 | 529 | ||||
| 2020-May | 05/01 | 552 | 05/08 | 592 | 05/15 | 631 | 05/22 | 663 | 05/29 | 694 | ||
| 2020-Jun | 06/05 | 719 | 06/12 | 747 | 06/19 | 776 | 06/26 | 804 | ||||
| 2020-Jul | 07/03 | 825 | 07/10 | 832 | 07/17 | 834 | 07/24 | 840 | 07/31 | 839 | ||
| 2020-Aug | 08/07 | 849 | 08/14 | 854 | 08/21 | 855 | 08/28 | 859 | ||||
| 2020-Sep | 09/04 | 851 | 09/11 | 848 | 09/18 | 844 | 09/25 | 839 | ||||
| 2020-Oct | 10/02 | 837 | 10/09 | 842 | 10/16 | 841 | 10/23 | 845 | 10/30 | 848 | ||
| 2020-Nov | 11/06 | 840 | 11/13 | 834 | 11/20 | 824 | 11/27 | 813 | ||||
| 2020-Dec | 12/04 | 793 | 12/11 | 791 | 12/18 | 788 | 12/25 | 794 | ||||
| 2021-Jan | 01/01 | 785 | 01/08 | 772 | 01/15 | 766 | 01/22 | 758 | 01/29 | 773 | ||
| 2021-Feb | 02/05 | 782 | 02/12 | 784 | 02/19 | 769 | 02/26 | 778 | ||||
| 2021-Mar | 03/05 | 787 | 03/12 | 798 | 03/19 | 827 | 03/26 | 844 | ||||
| 2021-Apr | 04/02 | 859 | 04/09 | 872 | 04/16 | 885 | 04/23 | 885 | 04/30 | 887 | ||
| 2021-May | 05/07 | 886 | 05/14 | 894 | 05/21 | 901 | 05/28 | 908 | ||||
| 2021-Jun | 06/04 | 913 | 06/11 | 909 | 06/18 | 913 | 06/25 | 919 | ||||
| 2021-Jul | 07/02 | 930 | 07/09 | 931 | 07/16 | 927 | 07/23 | 925 | 07/30 | 921 | ||
| 2021-Aug | 08/06 | 925 | 08/13 | 928 | 08/20 | 927 | 08/27 | 926 | ||||
| 2021-Sep | 09/03 | 920 | 09/10 | 914 | 09/17 | 907 | 09/24 | 903 | ||||
| 2021-Oct | 10/01 | 904 | 10/08 | 906 | 10/15 | 906 | 10/22 | 907 | 10/29 | 905 | ||
| 2021-Nov | 11/05 | 902 | 11/12 | 902 | 11/19 | 895 | 11/26 | 890 | ||||
| 2021-Dec | 12/03 | 882 | 12/10 | 878 | 12/17 | 877 | 12/24 | 883 | 12/31 | 863 | ||
| 2022-Jan | 01/07 | 832 | 01/14 | 813 | 01/21 | 784 | 01/28 | 794 | ||||
| 2022-Feb | 02/04 | 810 | 02/11 | 817 | 02/18 | 836 | 02/25 | 850 | ||||
| 2022-Mar | 03/04 | 869 | 03/11 | 885 | 03/18 | 884 | 03/25 | 876 | ||||
| 2022-Apr | 04/01 | 867 | 04/08 | 864 | 04/15 | 870 | 04/22 | 879 | 04/29 | 888 | ||
| 2022-May | 05/06 | 892 | 05/13 | 899 | 05/20 | 906 | 05/27 | 913 | ||||
| 2022-Jun | 06/03 | 912 | 06/10 | 909 | 06/17 | 906 | 06/24 | 902 | ||||
| 2022-Jul | 07/01 | 904 | 07/08 | 900 | 07/15 | 897 | 07/22 | 893 | 07/29 | 894 | ||
| 2022-Aug | 08/05 | 900 | 08/12 | 910 | 08/19 | 916 | 08/26 | 916 | ||||
| 2022-Sep | 09/02 | 915 | 09/09 | 906 | 09/16 | 896 | 09/23 | 897 | 09/30 | 895 | ||
| 2022-Oct | 10/07 | 897 | 10/14 | 905 | 10/21 | 906 | 10/28 | 908 | ||||
| 2022-Nov | 11/04 | 903 | 11/11 | 899 | 11/18 | 892 | 11/25 | 888 | ||||
| 2022-Dec | 12/02 | 879 | 12/09 | 876 | 12/16 | 873 | 12/23 | 880 | 12/30 | 865 | ||
| 2023-Jan | 01/06 | 837 | 01/13 | 827 | 01/20 | 805 | 01/27 | 817 | ||||
| 2023-Feb | 02/03 | 830 | 02/10 | 840 | 02/17 | 846 | 02/24 | 855 | ||||
| 2023-Mar | 03/03 | 868 | 03/10 | 869 | 03/17 | 876 | 03/24 | 879 | 03/31 | 884 | ||
| 2023-Apr | 04/07 | 887 | 04/14 | 887 | 04/21 | 890 | 04/28 | 896 | ||||
| 2023-May | 05/05 | 897 | 05/12 | 904 | 05/19 | 911 | 05/26 | 915 | ||||
| 2023-Jun | 06/02 | 913 | 06/09 | 914 | 06/16 | 907 | 06/23 | 900 | 06/30 | 909 | ||
| 2023-Jul | 07/07 | 904 | 07/14 | 902 | 07/21 | 906 | 07/28 | 906 | ||||
| 2023-Aug | 08/04 | 914 | 08/11 | 921 | 08/18 | 921 | 08/25 | 921 | ||||
| 2023-Sep | 09/01 | 917 | 09/08 | 910 | 09/15 | 904 | 09/22 | 897 | 09/29 | 894 | ||
| 2023-Oct | 10/06 | 895 | 10/13 | 901 | 10/20 | 905 | 10/27 | 907 | ||||
| 2023-Nov | 11/03 | 904 | 11/10 | 901 | 11/17 | 897 | 11/24 | 889 | ||||
| 2023-Dec | 12/01 | 882 | 12/08 | 877 | 12/15 | 880 | 12/22 | 888 | 12/29 | 874 | ||
| 2024-Jan | 01/05 | 855 | 01/12 | 838 | 01/19 | 812 | 01/26 | 816 | ||||
| 2024-Feb | 02/02 | 825 | 02/09 | 832 | 02/16 | 841 | 02/23 | 852 | ||||
| 2024-Mar | 03/01 | 861 | 03/08 | 865 | 03/15 | 878 | 03/22 | 875 | 03/29 | 880 | ||
| 2024-Apr | 04/05 | 881 | 04/12 | 885 | 04/19 | 894 | ||||||
| - = No Data Reported; -- = Not Applicable; NA = Not Available; W = Withheld to avoid disclosure of individual company data. |
| Release Date: 4/24/2024 |
| Next Release Date: 5/1/2024 |