|
Download Data (XLS File) |
|
||||||||
|
||||||||
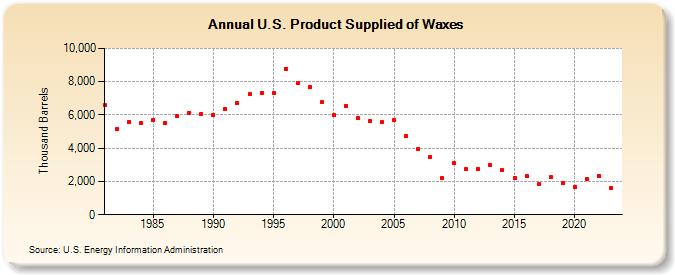
| U.S. Product Supplied of Waxes (Thousand Barrels) | ||||||||
| Decade | Year-0 | Year-1 | Year-2 | Year-3 | Year-4 | Year-5 | Year-6 | Year-7 | Year-8 | Year-9 |
|---|---|---|---|---|---|---|---|---|---|---|
| 1980's | 6,581 | 5,146 | 5,595 | 5,541 | 5,670 | 5,525 | 5,911 | 6,131 | 6,043 | |
| 1990's | 6,014 | 6,344 | 6,729 | 7,229 | 7,330 | 7,331 | 8,789 | 7,900 | 7,652 | 6,761 |
| 2000's | 5,975 | 6,563 | 5,810 | 5,606 | 5,555 | 5,665 | 4,722 | 3,953 | 3,457 | 2,207 |
| 2010's | 3,085 | 2,723 | 2,762 | 2,978 | 2,670 | 2,232 | 2,321 | 1,835 | 2,242 | 1,883 |
| 2020's | 1,663 | 2,130 | 2,355 | 1,633 |
| - = No Data Reported; -- = Not Applicable; NA = Not Available; W = Withheld to avoid disclosure of individual company data. |
| Release Date: 3/29/2024 |
| Next Release Date: 8/30/2024 |