|
Download Data (XLS File) |
|
||||||||
|
||||||||
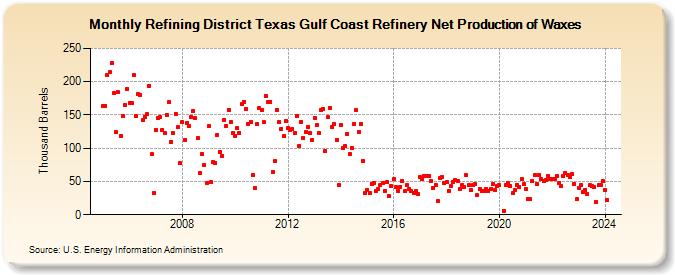
| Refining District Texas Gulf Coast Refinery Net Production of Waxes (Thousand Barrels) | ||||||||
| Year | Jan | Feb | Mar | Apr | May | Jun | Jul | Aug | Sep | Oct | Nov | Dec |
|---|---|---|---|---|---|---|---|---|---|---|---|---|
| 2005 | 163 | 164 | 210 | 214 | 228 | 183 | 124 | 184 | 119 | 148 | 165 | 189 |
| 2006 | 168 | 168 | 210 | 149 | 181 | 180 | 142 | 147 | 151 | 194 | 91 | 33 |
| 2007 | 128 | 146 | 147 | 128 | 123 | 150 | 169 | 110 | 123 | 152 | 132 | 77 |
| 2008 | 139 | 112 | 138 | 133 | 147 | 156 | 145 | 115 | 63 | 92 | 75 | 47 |
| 2009 | 133 | 49 | 79 | 78 | 120 | 95 | 89 | 143 | 133 | 158 | 139 | 123 |
| 2010 | 119 | 130 | 123 | 166 | 170 | 159 | 137 | 140 | 60 | 40 | 136 | 160 |
| 2011 | 158 | 139 | 179 | 169 | 170 | 64 | 80 | 158 | 140 | 129 | 118 | 141 |
| 2012 | 130 | 128 | 129 | 123 | 149 | 103 | 140 | 115 | 124 | 132 | 123 | 112 |
| 2013 | 146 | 135 | 123 | 157 | 159 | 96 | 147 | 161 | 132 | 136 | 113 | 44 |
| 2014 | 135 | 100 | 103 | 122 | 91 | 101 | 137 | 157 | 124 | 136 | 81 | 33 |
| 2015 | 37 | 32 | 46 | 48 | 35 | 38 | 44 | 48 | 36 | 49 | 28 | 43 |
| 2016 | 54 | 41 | 36 | 42 | 51 | 35 | 44 | 38 | 35 | 33 | 35 | 31 |
| 2017 | 56 | 54 | 58 | 58 | 58 | 51 | 40 | 45 | 20 | 55 | 57 | 48 |
| 2018 | 49 | 36 | 43 | 49 | 52 | 51 | 39 | 45 | 42 | 59 | 44 | 37 |
| 2019 | 44 | 46 | 29 | 39 | 36 | 35 | 39 | 36 | 38 | 46 | 37 | 43 |
| 2020 | 44 | 6 | 45 | 47 | 43 | 32 | 37 | 45 | 42 | 54 | 46 | |
| 2021 | 39 | 23 | 23 | 50 | 59 | 46 | 59 | 53 | 50 | 52 | 58 | 54 |
| 2022 | 54 | 53 | 58 | 48 | 43 | 58 | 63 | 59 | 56 | 61 | 46 | 23 |
| 2023 | 40 | 44 | 34 | 37 | 31 | 44 | 43 | 41 | 19 | 44 | 44 | 50 |
| 2024 | 37 | 22 | ||||||||||
| - = No Data Reported; -- = Not Applicable; NA = Not Available; W = Withheld to avoid disclosure of individual company data. |
| Release Date: 4/30/2024 |
| Next Release Date: 5/31/2024 |
Referring Pages: