|
Download Data (XLS File) |
|
||||||||
|
||||||||
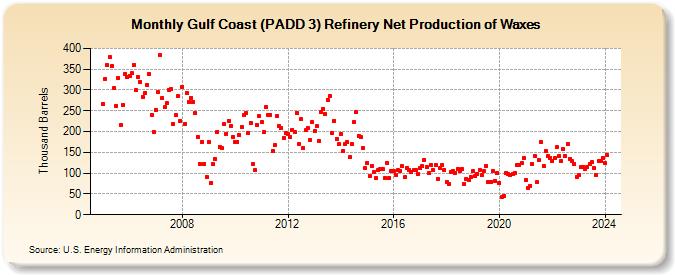
| Gulf Coast (PADD 3) Refinery Net Production of Waxes (Thousand Barrels) | ||||||||
| Year | Jan | Feb | Mar | Apr | May | Jun | Jul | Aug | Sep | Oct | Nov | Dec |
|---|---|---|---|---|---|---|---|---|---|---|---|---|
| 2005 | 267 | 327 | 359 | 379 | 358 | 305 | 261 | 329 | 215 | 264 | 338 | 330 |
| 2006 | 334 | 340 | 361 | 299 | 331 | 319 | 284 | 293 | 313 | 338 | 240 | 200 |
| 2007 | 253 | 294 | 384 | 281 | 258 | 268 | 301 | 302 | 219 | 239 | 285 | 226 |
| 2008 | 308 | 218 | 293 | 270 | 281 | 272 | 244 | 188 | 122 | 175 | 122 | 91 |
| 2009 | 175 | 77 | 123 | 135 | 200 | 163 | 160 | 218 | 195 | 226 | 214 | 188 |
| 2010 | 174 | 176 | 192 | 211 | 240 | 245 | 197 | 221 | 121 | 107 | 216 | 237 |
| 2011 | 222 | 198 | 259 | 239 | 241 | 154 | 167 | 237 | 213 | 208 | 185 | 196 |
| 2012 | 193 | 186 | 204 | 199 | 245 | 170 | 230 | 160 | 203 | 209 | 180 | 222 |
| 2013 | 202 | 213 | 178 | 247 | 255 | 242 | 276 | 285 | 196 | 226 | 183 | 169 |
| 2014 | 193 | 153 | 170 | 174 | 138 | 170 | 223 | 246 | 189 | 186 | 161 | 112 |
| 2015 | 124 | 93 | 118 | 103 | 88 | 107 | 109 | 109 | 88 | 125 | 88 | 104 |
| 2016 | 104 | 96 | 107 | 105 | 116 | 90 | 113 | 108 | 103 | 107 | 107 | 98 |
| 2017 | 112 | 116 | 132 | 115 | 100 | 120 | 107 | 120 | 87 | 112 | 119 | 108 |
| 2018 | 79 | 74 | 103 | 105 | 101 | 110 | 106 | 109 | 74 | 85 | 84 | 91 |
| 2019 | 104 | 92 | 97 | 107 | 95 | 104 | 118 | 78 | 78 | 105 | 82 | 100 |
| 2020 | 77 | 42 | 45 | 101 | 97 | 95 | 98 | 101 | 120 | 120 | 124 | 136 |
| 2021 | 83 | 65 | 70 | 122 | 141 | 78 | 131 | 174 | 118 | 153 | 141 | 137 |
| 2022 | 129 | 136 | 162 | 141 | 129 | 158 | 141 | 170 | 135 | 129 | 122 | 91 |
| 2023 | 95 | 115 | 115 | 110 | 115 | 123 | 126 | 113 | 95 | 128 | 128 | 137 |
| 2024 | 124 | 143 | 155 | 137 | 152 | 141 | ||||||
| - = No Data Reported; -- = Not Applicable; NA = Not Available; W = Withheld to avoid disclosure of individual company data. |
| Release Date: 8/30/2024 |
| Next Release Date: 9/30/2024 |
Referring Pages: