|
Download Data (XLS File) |
|
||||||||
|
||||||||
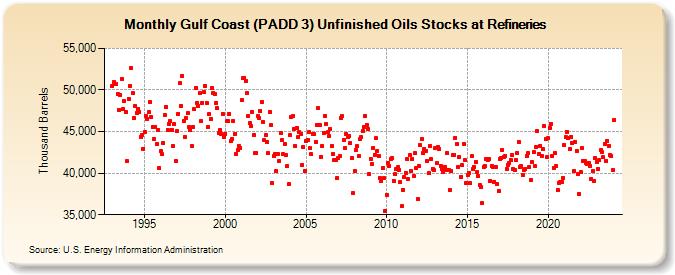
| Gulf Coast (PADD 3) Unfinished Oils Stocks at Refineries (Thousand Barrels) | ||||||||
| Year | Jan | Feb | Mar | Apr | May | Jun | Jul | Aug | Sep | Oct | Nov | Dec |
|---|---|---|---|---|---|---|---|---|---|---|---|---|
| 1993 | 50,460 | 50,984 | 50,719 | 50,746 | 49,571 | 47,646 | 49,446 | 51,343 | 47,737 | 48,636 | 47,384 | 41,449 |
| 1994 | 48,974 | 50,518 | 52,652 | 49,619 | 46,626 | 48,071 | 47,243 | 47,746 | 47,359 | 44,403 | 44,619 | 42,962 |
| 1995 | 44,975 | 46,837 | 46,532 | 47,329 | 48,498 | 46,690 | 45,555 | 44,132 | 45,597 | 43,474 | 45,199 | 40,597 |
| 1996 | 42,655 | 42,268 | 43,645 | 47,036 | 47,960 | 45,204 | 45,882 | 46,249 | 45,230 | 43,209 | 45,893 | 41,478 |
| 1997 | 45,049 | 47,168 | 50,787 | 48,130 | 51,724 | 46,267 | 44,373 | 46,625 | 47,175 | 45,547 | 45,147 | 43,290 |
| 1998 | 45,520 | 47,654 | 50,275 | 48,461 | 48,073 | 49,580 | 46,262 | 48,487 | 49,775 | 50,505 | 48,440 | 45,578 |
| 1999 | 47,103 | 46,564 | 50,251 | 49,670 | 49,571 | 48,434 | 47,777 | 44,811 | 45,182 | 44,676 | 47,133 | 44,341 |
| 2000 | 44,752 | 46,239 | 46,235 | 47,156 | 43,822 | 44,152 | 46,274 | 44,695 | 42,285 | 42,779 | 43,285 | 43,041 |
| 2001 | 48,784 | 51,400 | 51,484 | 51,045 | 49,619 | 46,830 | 46,011 | 45,639 | 47,377 | 44,640 | 42,416 | 42,444 |
| 2002 | 46,862 | 46,616 | 47,528 | 48,596 | 46,173 | 43,943 | 44,619 | 43,802 | 42,412 | 47,393 | 45,747 | 38,779 |
| 2003 | 42,076 | 42,274 | 40,247 | 42,312 | 41,407 | 44,827 | 43,956 | 42,252 | 43,554 | 42,209 | 40,854 | 38,642 |
| 2004 | 44,530 | 46,720 | 46,813 | 45,350 | 43,289 | 45,471 | 44,291 | 44,920 | 44,658 | 40,959 | 43,183 | 40,267 |
| 2005 | 43,820 | 43,978 | 44,922 | 42,982 | 42,248 | 44,734 | 44,663 | 43,714 | 45,808 | 47,784 | 45,829 | 41,961 |
| 2006 | 43,252 | 44,778 | 46,890 | 45,908 | 44,915 | 44,493 | 45,298 | 43,234 | 42,334 | 41,612 | 41,552 | 39,406 |
| 2007 | 41,779 | 42,048 | 46,680 | 46,841 | 43,997 | 43,018 | 44,710 | 44,302 | 44,455 | 43,593 | 41,792 | 37,586 |
| 2008 | 40,247 | 42,768 | 43,213 | 42,086 | 44,099 | 44,351 | 45,065 | 45,577 | 46,867 | 45,836 | 45,332 | 39,853 |
| 2009 | 41,685 | 41,128 | 43,036 | 42,215 | 44,171 | 42,688 | 42,111 | 39,412 | 39,053 | 40,643 | 39,397 | 35,482 |
| 2010 | 37,407 | 41,237 | 40,846 | 41,682 | 41,806 | 39,112 | 39,862 | 40,460 | 40,700 | 40,432 | 38,927 | 36,008 |
| 2011 | 38,002 | 39,545 | 40,069 | 41,643 | 39,313 | 42,163 | 40,226 | 41,755 | 39,613 | 42,391 | 40,617 | 36,882 |
| 2012 | 40,841 | 43,343 | 44,118 | 42,402 | 42,916 | 42,630 | 41,444 | 40,002 | 43,304 | 41,689 | 40,549 | 40,388 |
| 2013 | 43,081 | 41,217 | 43,157 | 42,924 | 40,905 | 40,440 | 40,079 | 40,751 | 40,390 | 42,432 | 40,397 | 37,983 |
| 2014 | 40,247 | 42,161 | 42,226 | 44,280 | 43,558 | 40,762 | 41,929 | 39,586 | 40,935 | 43,537 | 41,609 | 38,779 |
| 2015 | 39,739 | 40,034 | 38,782 | 42,009 | 40,473 | 40,787 | 41,310 | 40,079 | 39,647 | 38,588 | 38,316 | 36,361 |
| 2016 | 40,767 | 40,798 | 41,757 | 41,580 | 41,716 | 39,085 | 40,905 | 40,740 | 38,971 | 40,700 | 38,712 | 37,905 |
| 2017 | 41,746 | 41,832 | 42,810 | 41,991 | 42,063 | 40,512 | 41,032 | 41,207 | 41,622 | 42,128 | 40,442 | 40,411 |
| 2018 | 41,568 | 42,434 | 43,787 | 40,722 | 40,840 | 39,826 | 40,432 | 40,506 | 42,062 | 42,377 | 40,730 | 39,206 |
| 2019 | 41,365 | 42,491 | 40,827 | 43,181 | 45,023 | 42,334 | 43,284 | 42,093 | 42,861 | 45,704 | 44,053 | 41,904 |
| 2020 | 44,176 | 45,461 | 45,928 | 42,045 | 40,624 | 42,434 | 40,814 | 38,006 | 38,828 | 38,905 | 38,910 | 39,464 |
| 2021 | 43,389 | 44,292 | 44,997 | 44,197 | 42,925 | 44,369 | 43,581 | 40,249 | 43,784 | 42,674 | 39,926 | 37,501 |
| 2022 | 40,109 | 43,031 | 41,495 | 41,512 | 41,275 | 41,118 | 41,191 | 40,917 | 39,272 | 40,238 | 39,080 | 41,853 |
| 2023 | 41,374 | 40,554 | 41,530 | 42,745 | 42,507 | 41,880 | 43,477 | 41,517 | 43,876 | 43,264 | 42,123 | 42,056 |
| 2024 | 40,338 | |||||||||||
| - = No Data Reported; -- = Not Applicable; NA = Not Available; W = Withheld to avoid disclosure of individual company data. |
| Release Date: 3/29/2024 |
| Next Release Date: 4/30/2024 |