|
Download Data (XLS File) |
|
||||||||
|
||||||||
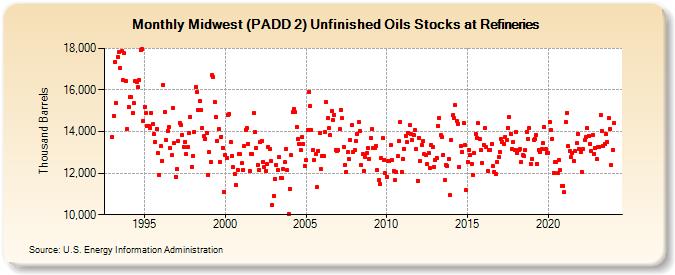
| Midwest (PADD 2) Unfinished Oils Stocks at Refineries (Thousand Barrels) | ||||||||
| Year | Jan | Feb | Mar | Apr | May | Jun | Jul | Aug | Sep | Oct | Nov | Dec |
|---|---|---|---|---|---|---|---|---|---|---|---|---|
| 1993 | 13,735 | 14,767 | 17,349 | 15,376 | 17,600 | 17,836 | 17,046 | 17,860 | 16,458 | 17,758 | 16,439 | 14,124 |
| 1994 | 15,192 | 15,652 | 15,656 | 14,913 | 15,368 | 16,427 | 16,378 | 16,124 | 16,486 | 17,932 | 17,967 | 14,521 |
| 1995 | 15,196 | 14,876 | 14,271 | 14,263 | 14,194 | 14,900 | 14,357 | 13,875 | 13,518 | 14,135 | 12,966 | 11,917 |
| 1996 | 13,284 | 12,606 | 16,246 | 14,938 | 13,570 | 14,034 | 14,216 | 13,214 | 12,859 | 15,139 | 13,442 | 11,834 |
| 1997 | 12,194 | 13,548 | 14,421 | 14,327 | 13,838 | 13,257 | 13,511 | 12,923 | 13,264 | 13,923 | 14,707 | 12,309 |
| 1998 | 12,837 | 13,982 | 16,153 | 15,890 | 15,020 | 15,462 | 15,035 | 14,174 | 13,763 | 13,658 | 13,932 | 11,925 |
| 1999 | 13,000 | 12,533 | 16,702 | 16,619 | 15,420 | 14,720 | 13,567 | 14,101 | 12,542 | 13,762 | 13,226 | 11,082 |
| 2000 | 12,884 | 12,747 | 14,781 | 14,842 | 13,489 | 12,824 | 12,276 | 11,975 | 11,442 | 12,152 | 12,920 | 12,898 |
| 2001 | 12,468 | 12,140 | 13,292 | 14,097 | 14,157 | 13,419 | 12,092 | 12,900 | 12,915 | 14,895 | 13,965 | 13,222 |
| 2002 | 12,381 | 12,164 | 13,481 | 13,542 | 12,552 | 12,301 | 12,114 | 12,451 | 13,263 | 13,139 | 12,591 | 10,477 |
| 2003 | 10,917 | 11,728 | 12,413 | 12,161 | 12,780 | 11,787 | 11,743 | 12,211 | 12,513 | 13,165 | 12,147 | 10,042 |
| 2004 | 11,252 | 12,862 | 14,927 | 15,078 | 14,922 | 14,236 | 13,664 | 13,410 | 13,109 | 13,719 | 13,406 | 12,353 |
| 2005 | 12,609 | 14,068 | 15,913 | 15,237 | 14,064 | 13,096 | 12,616 | 12,907 | 11,321 | 13,068 | 13,916 | 12,177 |
| 2006 | 12,814 | 12,839 | 13,971 | 15,411 | 14,639 | 14,153 | 13,819 | 14,985 | 14,559 | 14,808 | 13,118 | 13,049 |
| 2007 | 13,103 | 14,106 | 15,041 | 14,634 | 13,275 | 12,395 | 12,072 | 12,997 | 12,675 | 13,615 | 14,303 | 13,029 |
| 2008 | 13,122 | 13,524 | 13,899 | 14,455 | 14,044 | 12,381 | 12,928 | 12,111 | 12,793 | 12,951 | 13,194 | 12,681 |
| 2009 | 13,696 | 14,114 | 13,190 | 13,211 | 13,308 | 12,130 | 11,647 | 11,476 | 12,711 | 13,676 | 12,654 | 11,985 |
| 2010 | 11,835 | 12,571 | 12,605 | 13,353 | 12,618 | 12,104 | 11,657 | 12,032 | 12,805 | 13,541 | 14,467 | 12,077 |
| 2011 | 12,675 | 13,178 | 13,804 | 13,484 | 13,915 | 14,293 | 13,889 | 13,591 | 13,818 | 14,056 | 13,149 | 11,640 |
| 2012 | 13,704 | 12,581 | 13,375 | 13,550 | 12,905 | 12,884 | 12,434 | 12,971 | 12,256 | 13,353 | 13,259 | 12,314 |
| 2013 | 12,636 | 12,749 | 14,280 | 14,661 | 13,820 | 13,726 | 12,875 | 11,649 | 12,380 | 12,357 | 12,686 | 10,947 |
| 2014 | 13,607 | 14,779 | 14,636 | 15,276 | 14,504 | 14,376 | 12,316 | 13,288 | 13,035 | 14,393 | 13,357 | 11,193 |
| 2015 | 12,537 | 13,123 | 12,874 | 12,458 | 11,913 | 12,969 | 13,891 | 13,709 | 14,390 | 13,625 | 13,103 | 12,502 |
| 2016 | 13,374 | 14,194 | 13,239 | 12,123 | 13,094 | 13,136 | 13,417 | 12,351 | 12,075 | 11,980 | 12,547 | 12,759 |
| 2017 | 13,032 | 13,640 | 13,513 | 13,423 | 13,745 | 13,589 | 14,191 | 14,701 | 13,899 | 13,160 | 13,493 | 13,130 |
| 2018 | 13,968 | 12,973 | 13,136 | 13,147 | 12,529 | 12,852 | 12,804 | 13,110 | 14,002 | 13,649 | 14,175 | 12,449 |
| 2019 | 12,686 | 13,586 | 13,659 | 13,839 | 12,456 | 13,120 | 13,001 | 13,147 | 13,427 | 14,212 | 13,152 | 12,962 |
| 2020 | 12,969 | 14,440 | 14,072 | 13,658 | 12,002 | 12,535 | 12,540 | 11,986 | 12,626 | 12,143 | 11,400 | 11,403 |
| 2021 | 11,077 | 14,461 | 14,909 | 13,289 | 13,056 | 12,756 | 12,960 | 12,580 | 13,050 | 13,448 | 13,904 | 13,167 |
| 2022 | 12,994 | 12,056 | 13,156 | 13,583 | 13,737 | 14,162 | 13,794 | 13,419 | 13,065 | 13,858 | 12,933 | 13,188 |
| 2023 | 12,673 | 13,233 | 13,268 | 14,807 | 14,031 | 13,304 | 13,406 | 13,869 | 13,513 | 14,633 | 14,115 | 12,380 |
| 2024 | 13,104 | |||||||||||
| - = No Data Reported; -- = Not Applicable; NA = Not Available; W = Withheld to avoid disclosure of individual company data. |
| Release Date: 3/29/2024 |
| Next Release Date: 4/30/2024 |