|
Download Data (XLS File) |
|
||||||||
|
||||||||
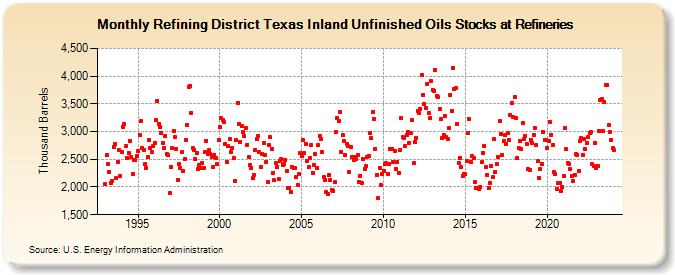
| Refining District Texas Inland Unfinished Oils Stocks at Refineries (Thousand Barrels) | ||||||||
| Year | Jan | Feb | Mar | Apr | May | Jun | Jul | Aug | Sep | Oct | Nov | Dec |
|---|---|---|---|---|---|---|---|---|---|---|---|---|
| 1993 | 2,056 | 2,571 | 2,407 | 2,269 | 2,074 | 2,111 | 2,730 | 2,767 | 2,161 | 2,456 | 2,661 | 2,206 |
| 1994 | 2,636 | 3,088 | 3,132 | 2,745 | 2,514 | 2,622 | 2,829 | 2,534 | 2,232 | 2,491 | 2,491 | 2,559 |
| 1995 | 2,651 | 2,935 | 3,183 | 2,698 | 2,669 | 2,409 | 2,347 | 2,549 | 2,845 | 2,701 | 2,632 | 2,733 |
| 1996 | 2,788 | 3,205 | 3,552 | 3,142 | 3,078 | 2,970 | 2,802 | 2,696 | 2,919 | 2,591 | 2,571 | 1,892 |
| 1997 | 2,355 | 2,706 | 3,015 | 2,895 | 2,684 | 2,120 | 2,408 | 2,342 | 2,627 | 2,296 | 2,498 | 2,849 |
| 1998 | 3,123 | 3,810 | 3,825 | 3,343 | 2,695 | 2,676 | 2,498 | 2,615 | 2,318 | 2,402 | 2,345 | 2,435 |
| 1999 | 2,334 | 2,640 | 2,831 | 2,590 | 2,666 | 2,598 | 2,538 | 2,361 | 2,586 | 2,516 | 2,414 | 2,849 |
| 2000 | 3,086 | 3,238 | 3,213 | 3,165 | 2,774 | 2,448 | 2,732 | 2,869 | 2,623 | 2,699 | 2,514 | 2,101 |
| 2001 | 2,846 | 3,524 | 3,132 | 2,818 | 3,097 | 2,995 | 2,915 | 3,057 | 2,764 | 2,538 | 2,389 | 2,338 |
| 2002 | 2,154 | 2,216 | 2,669 | 2,862 | 2,925 | 2,623 | 2,362 | 2,598 | 2,789 | 2,586 | 2,455 | 2,091 |
| 2003 | 2,761 | 2,895 | 2,694 | 2,260 | 2,121 | 2,435 | 2,357 | 2,144 | 2,466 | 2,504 | 2,400 | 2,419 |
| 2004 | 2,487 | 2,293 | 1,975 | 1,982 | 1,904 | 2,357 | 2,343 | 2,336 | 2,188 | 2,044 | 2,229 | 2,610 |
| 2005 | 2,554 | 2,850 | 2,605 | 2,783 | 2,468 | 2,354 | 2,526 | 2,751 | 2,258 | 2,393 | 2,587 | 2,350 |
| 2006 | 2,751 | 2,921 | 2,857 | 2,632 | 2,183 | 2,122 | 1,912 | 1,882 | 2,213 | 2,122 | 1,946 | 1,929 |
| 2007 | 2,085 | 2,985 | 3,240 | 3,188 | 3,361 | 2,640 | 2,931 | 2,832 | 2,586 | 2,782 | 2,735 | 2,263 |
| 2008 | 2,713 | 2,542 | 2,488 | 2,535 | 2,506 | 2,572 | 2,092 | 2,203 | 2,078 | 2,498 | 2,321 | 2,382 |
| 2009 | 2,540 | 2,560 | 2,974 | 2,884 | 3,344 | 3,221 | 2,693 | 2,222 | 1,806 | 2,345 | 2,036 | 2,243 |
| 2010 | 2,295 | 2,406 | 2,429 | 2,243 | 2,409 | 2,688 | 2,693 | 2,451 | 2,654 | 2,333 | 2,451 | 2,260 |
| 2011 | 2,665 | 3,245 | 2,897 | 2,883 | 2,739 | 2,934 | 2,985 | 2,801 | 2,968 | 3,200 | 2,428 | 2,809 |
| 2012 | 2,886 | 3,374 | 3,335 | 3,404 | 4,027 | 3,655 | 3,505 | 3,422 | 3,865 | 3,327 | 3,240 | 3,916 |
| 2013 | 3,758 | 3,740 | 4,110 | 3,639 | 3,629 | 3,409 | 3,219 | 2,880 | 2,938 | 3,287 | 2,895 | 2,872 |
| 2014 | 3,068 | 3,661 | 3,377 | 4,150 | 3,761 | 3,779 | 3,140 | 2,425 | 2,514 | 2,354 | 2,199 | 2,235 |
| 2015 | 2,238 | 2,472 | 2,982 | 3,221 | 2,442 | 2,555 | 2,517 | 2,084 | 1,987 | 1,986 | 1,967 | 2,006 |
| 2016 | 2,443 | 2,622 | 2,739 | 2,355 | 2,224 | 1,977 | 2,076 | 2,376 | 2,174 | 2,862 | 2,279 | 2,412 |
| 2017 | 2,548 | 3,193 | 2,958 | 2,584 | 2,827 | 2,939 | 2,777 | 2,976 | 2,848 | 3,295 | 3,516 | 3,262 |
| 2018 | 3,620 | 3,251 | 2,520 | 2,707 | 2,828 | 2,677 | 3,159 | 2,866 | 2,916 | 2,776 | 2,316 | 2,312 |
| 2019 | 2,854 | 2,794 | 2,941 | 3,073 | 2,754 | 2,464 | 2,160 | 2,321 | 2,414 | 3,000 | 2,850 | 2,841 |
| 2020 | 2,701 | 2,828 | 3,178 | 2,944 | 2,750 | 2,264 | 2,243 | 1,962 | 2,076 | 2,077 | 1,919 | 2,005 |
| 2021 | 2,196 | 3,059 | 2,679 | 2,433 | 2,406 | 2,321 | 2,192 | 2,100 | 2,223 | 2,601 | 2,581 | 2,290 |
| 2022 | 2,834 | 2,878 | 2,585 | 2,871 | 2,682 | 2,791 | 2,907 | 2,980 | 2,989 | 2,410 | 2,380 | 2,802 |
| 2023 | 2,339 | 2,380 | 3,004 | 3,562 | 3,583 | 3,009 | 3,531 | 3,833 | 3,837 | 3,112 | 2,998 | 2,856 |
| 2024 | 2,709 | |||||||||||
| - = No Data Reported; -- = Not Applicable; NA = Not Available; W = Withheld to avoid disclosure of individual company data. |
| Release Date: 3/29/2024 |
| Next Release Date: 4/30/2024 |
Referring Pages: