|
Download Data (XLS File) |
|
||||||||
|
||||||||
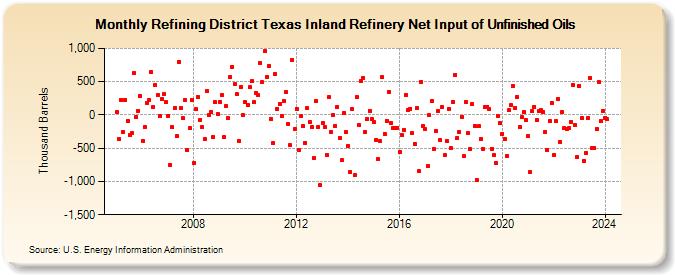
| Refining District Texas Inland Refinery Net Input of Unfinished Oils (Thousand Barrels) | ||||||||
| Year | Jan | Feb | Mar | Apr | May | Jun | Jul | Aug | Sep | Oct | Nov | Dec |
|---|---|---|---|---|---|---|---|---|---|---|---|---|
| 2005 | 40 | -359 | 231 | -254 | 229 | -84 | -304 | -278 | 631 | -33 | 64 | 286 |
| 2006 | -393 | -180 | 180 | 224 | 648 | 126 | 449 | 296 | -18 | 246 | 309 | 191 |
| 2007 | -11 | -750 | -188 | 98 | -320 | 801 | 100 | -52 | 217 | -534 | -195 | 222 |
| 2008 | -716 | 83 | 267 | -69 | -188 | -362 | 357 | -2 | 45 | -329 | 189 | 12 |
| 2009 | 200 | 297 | -336 | 134 | -52 | 567 | 723 | 467 | 309 | -396 | 417 | -4 |
| 2010 | 192 | 154 | 414 | 511 | 189 | 336 | 297 | 778 | 490 | 956 | 575 | 740 |
| 2011 | -63 | -420 | 616 | 95 | 161 | -23 | 202 | 345 | -130 | -459 | 821 | -214 |
| 2012 | 93 | -523 | -17 | -169 | -416 | 100 | -110 | -186 | -646 | 209 | -178 | -1,054 |
| 2013 | -116 | -176 | -597 | 267 | -250 | 5 | -164 | 120 | -343 | -682 | 30 | -259 |
| 2014 | -469 | -858 | 88 | -908 | 266 | -154 | 514 | 555 | -251 | -58 | 63 | -54 |
| 2015 | -111 | -379 | -666 | -396 | 564 | -282 | -85 | 352 | -124 | -198 | -200 | -194 |
| 2016 | -554 | -304 | -221 | 301 | 76 | 95 | -279 | -431 | 97 | -848 | 502 | -165 |
| 2017 | -211 | -770 | -6 | 213 | -506 | -240 | 57 | -376 | 116 | -606 | -394 | 90 |
| 2018 | -494 | 198 | 604 | -349 | -253 | -26 | -622 | 200 | -273 | -516 | 158 | -167 |
| 2019 | -971 | -172 | -366 | -505 | 123 | 125 | 86 | -508 | -606 | -725 | -11 | -118 |
| 2020 | -283 | -355 | -610 | 67 | 148 | 438 | 109 | 271 | -185 | -36 | 42 | -79 |
| 2021 | -323 | -864 | 55 | 123 | -73 | 54 | 71 | 40 | -253 | -520 | -91 | 185 |
| 2022 | -600 | -98 | 239 | -400 | 41 | -198 | -208 | -201 | -100 | 457 | -155 | -633 |
| 2023 | 437 | -40 | -686 | -572 | -48 | 562 | -494 | -499 | -211 | 493 | -95 | 66 |
| 2024 | -39 | |||||||||||
| - = No Data Reported; -- = Not Applicable; NA = Not Available; W = Withheld to avoid disclosure of individual company data. |
| Release Date: 3/29/2024 |
| Next Release Date: 4/30/2024 |