|
Download Data (XLS File) |
|
||||||||
|
||||||||
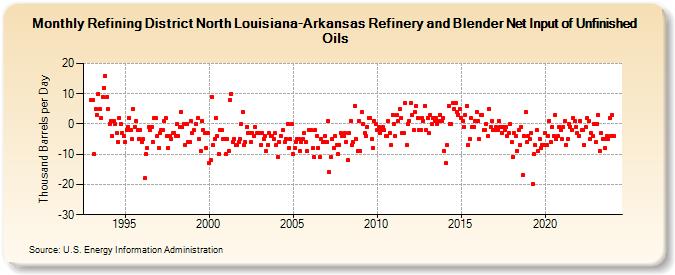
| Refining District North Louisiana-Arkansas Refinery and Blender Net Input of Unfinished Oils (Thousand Barrels per Day) | ||||||||
| Year | Jan | Feb | Mar | Apr | May | Jun | Jul | Aug | Sep | Oct | Nov | Dec |
|---|---|---|---|---|---|---|---|---|---|---|---|---|
| 1993 | 8 | 8 | -10 | 5 | 3 | 10 | 5 | 2 | 9 | 12 | 16 | 9 |
| 1994 | 5 | 0 | 1 | -4 | 1 | 0 | -3 | -6 | 2 | 0 | -3 | -4 |
| 1995 | -6 | -2 | -1 | 2 | -2 | -5 | 5 | -1 | 1 | -2 | -5 | -2 |
| 1996 | -6 | -5 | -18 | -10 | -8 | -1 | -2 | -1 | -6 | 2 | 2 | -4 |
| 1997 | -8 | -3 | -2 | -2 | 1 | 2 | -4 | -8 | -4 | -5 | -3 | -3 |
| 1998 | -4 | 0 | -4 | -1 | 4 | -1 | 0 | -7 | 0 | -6 | -6 | 1 |
| 1999 | -3 | -2 | 0 | 2 | -5 | -9 | 1 | -2 | -3 | -8 | -3 | |
| 2000 | -13 | -12 | 9 | -7 | -5 | 2 | -4 | -10 | -2 | -2 | -5 | -5 |
| 2001 | -10 | -5 | -9 | 8 | 10 | -6 | -5 | -7 | -7 | -6 | -5 | 0 |
| 2002 | 4 | -7 | -6 | -1 | -3 | -3 | -6 | -3 | -4 | -1 | -3 | -3 |
| 2003 | -3 | -7 | -3 | -5 | -4 | -9 | -7 | -3 | -4 | -4 | -5 | -3 |
| 2004 | -7 | -11 | -6 | -4 | -2 | -6 | -5 | 0 | -8 | -5 | 0 | |
| 2005 | -10 | -8 | -6 | -5 | -5 | -9 | -6 | -5 | -3 | -6 | -9 | -2 |
| 2006 | -2 | -2 | -8 | -11 | -2 | -4 | -8 | -11 | -5 | -6 | -6 | -4 |
| 2007 | -6 | 1 | -16 | -11 | -5 | -8 | -4 | -7 | -10 | -7 | -3 | -4 |
| 2008 | -4 | -3 | -6 | -12 | -3 | 1 | -7 | -6 | 6 | -5 | -9 | 1 |
| 2009 | -9 | 4 | 0 | -3 | -4 | -1 | 2 | 2 | -5 | -8 | 1 | 0 |
| 2010 | -2 | -1 | -3 | -2 | -1 | -2 | -4 | -4 | 1 | -3 | -7 | 3 |
| 2011 | 0 | -4 | 3 | 1 | 5 | 2 | -3 | -3 | 7 | -7 | 0 | 1 |
| 2012 | 7 | 3 | -2 | 4 | 6 | 2 | -2 | -2 | 2 | 1 | 6 | -2 |
| 2013 | 2 | -3 | 3 | 0 | 2 | 1 | 2 | 0 | 1 | 3 | 1 | 2 |
| 2014 | -9 | -13 | -7 | 6 | 0 | 0 | 7 | 5 | 7 | 4 | 3 | 5 |
| 2015 | 2 | 1 | -1 | 3 | 6 | -7 | -5 | 2 | -1 | -1 | 1 | 4 |
| 2016 | 1 | -5 | 3 | 3 | -2 | -2 | 0 | -4 | 5 | -1 | 1 | -2 |
| 2017 | -2 | -1 | -2 | 1 | -1 | -3 | -1 | -2 | -1 | -4 | -3 | 0 |
| 2018 | -6 | -11 | -3 | -4 | -9 | -2 | -7 | -1 | -17 | -4 | 4 | -6 |
| 2019 | -4 | -5 | -3 | -20 | -10 | -7 | -2 | -9 | -5 | -8 | -7 | -7 |
| 2020 | -3 | -7 | -4 | 1 | -6 | -1 | -4 | 3 | -5 | -4 | -1 | -2 |
| 2021 | -5 | -1 | 1 | -7 | -5 | 0 | -1 | -2 | 2 | 1 | -1 | -3 |
| 2022 | -4 | 1 | -2 | -2 | -7 | -1 | 2 | 1 | -5 | -3 | -4 | 0 |
| 2023 | -6 | 0 | 3 | -9 | -3 | -5 | -5 | -8 | -4 | -5 | 2 | -4 |
| 2024 | 3 | |||||||||||
| - = No Data Reported; -- = Not Applicable; NA = Not Available; W = Withheld to avoid disclosure of individual company data. |
| Release Date: 3/29/2024 |
| Next Release Date: 4/30/2024 |