|
Download Data (XLS File) |
|
||||||||
|
||||||||
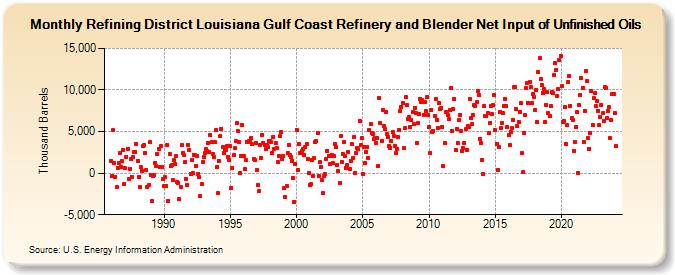
| Refining District Louisiana Gulf Coast Refinery and Blender Net Input of Unfinished Oils (Thousand Barrels) | ||||||||
| Year | Jan | Feb | Mar | Apr | May | Jun | Jul | Aug | Sep | Oct | Nov | Dec |
|---|---|---|---|---|---|---|---|---|---|---|---|---|
| 1986 | 1,509 | -331 | 5,132 | 1,261 | -442 | -1,713 | 619 | 1,205 | 2,424 | 742 | 1,456 | 2,834 |
| 1987 | -1,268 | 635 | 1,986 | 2,958 | -761 | 542 | 1,646 | -407 | 1,929 | 2,553 | 2,548 | 3,549 |
| 1988 | 1,493 | -437 | -1,724 | 683 | 258 | 3,207 | 3,332 | 2,438 | 357 | -1,699 | -1,460 | 3,729 |
| 1989 | -209 | -3,338 | -348 | -270 | 1,229 | 844 | 2,292 | 2,886 | 735 | 3,244 | 739 | -722 |
| 1990 | -1,588 | -525 | -1,556 | 3,396 | -3,326 | 2,326 | 839 | 942 | -838 | 1,598 | 1,096 | 2,105 |
| 1991 | -1,098 | -1,149 | -3,140 | -1,646 | 3,409 | 2,456 | 2,183 | 1,316 | -671 | -1,434 | 3,380 | 2,818 |
| 1992 | -78 | 1,623 | -28 | 2,232 | 2,150 | 819 | 2,069 | -53 | -525 | -2,798 | -1,344 | 1,359 |
| 1993 | 1,929 | 2,434 | 2,899 | 2,620 | 3,659 | 2,527 | 4,527 | 3,718 | 2,350 | 1,918 | 3,755 | 5,211 |
| 1994 | 746 | -2,447 | 1,436 | 4,431 | 5,345 | 3,164 | 2,397 | 2,939 | 2,810 | 3,219 | 1,976 | 1,580 |
| 1995 | 3,253 | -1,769 | 610 | 2,177 | 2,979 | 3,836 | 5,969 | 5,023 | 3,755 | 20 | 2,110 | 5,808 |
| 1996 | 2,065 | 465 | 1,599 | 3,756 | 3,711 | 3,885 | 3,895 | 4,225 | 3,501 | 1,713 | 1,622 | 3,620 |
| 1997 | 401 | -1,400 | -2,185 | 3,427 | 1,855 | 4,600 | 3,590 | 3,383 | 2,885 | 3,334 | 3,153 | 3,827 |
| 1998 | 3,873 | 3,699 | 2,449 | 4,355 | 2,933 | 3,643 | 3,015 | 1,311 | 2,054 | 4,409 | 4,929 | 1,684 |
| 1999 | 2,049 | -1,819 | -2,862 | -1,556 | 2,445 | 3,425 | 2,142 | 1,961 | 1,495 | -545 | -3,436 | 1,139 |
| 2000 | 5,238 | 339 | 3,469 | 2,449 | 2,398 | 2,681 | 2,892 | 2,199 | 3,083 | 3,559 | 1,704 | 27 |
| 2001 | -1,387 | -1,345 | 1,628 | -325 | 1,813 | 3,729 | 3,866 | 4,838 | -326 | 1,280 | 733 | -808 |
| 2002 | -2,426 | -364 | -161 | 1,731 | 2,688 | 2,021 | 1,061 | 2,118 | 2,217 | 1,168 | 2,015 | 3,512 |
| 2003 | 3,155 | 973 | 233 | -1,210 | 4,409 | 1,348 | 2,358 | 3,783 | 2,063 | 657 | 1,032 | 2,525 |
| 2004 | 510 | 1,519 | 3,518 | 1,818 | 4,295 | 5 | 2,428 | 2,971 | 2,851 | 6,308 | 3,344 | 4,216 |
| 2005 | -45 | 3,117 | 1,195 | 2,592 | 3,100 | 1,855 | 5,132 | 5,876 | 4,795 | 4,749 | 4,075 | 4,174 |
| 2006 | 3,653 | 4,248 | 910 | 9,062 | 5,982 | 3,879 | 7,589 | 5,676 | 5,287 | 7,333 | 4,677 | 4,350 |
| 2007 | 3,309 | 3,029 | 3,911 | 4,906 | 4,503 | 3,251 | 2,441 | 2,845 | 4,308 | 5,211 | 7,519 | 7,931 |
| 2008 | 8,482 | 2,969 | 5,426 | 9,117 | 8,158 | 6,515 | 6,721 | 5,571 | 6,388 | 7,391 | 5,919 | 7,867 |
| 2009 | 7,271 | 3,663 | 5,990 | 7,132 | 8,888 | 8,548 | 8,768 | 7,026 | 8,538 | 7,417 | 9,099 | 7,019 |
| 2010 | 5,547 | 2,424 | 7,599 | 4,938 | 5,052 | 6,847 | 8,924 | 6,391 | 5,475 | 8,456 | 7,727 | 7,815 |
| 2011 | 5,584 | 810 | 3,676 | 7,333 | 7,352 | 6,950 | 6,496 | 7,543 | 10,268 | 5,040 | 7,666 | 8,964 |
| 2012 | 2,800 | 5,337 | 3,672 | 6,363 | 7,036 | 5,082 | 2,710 | 3,027 | 3,605 | 5,268 | 2,836 | 5,710 |
| 2013 | 5,498 | 8,933 | 6,590 | 5,874 | 6,996 | 8,159 | 8,098 | 8,567 | 9,923 | 9,363 | 4,153 | 3,608 |
| 2014 | 1,573 | -64 | 8,068 | 6,833 | 6,831 | 7,235 | 4,779 | 6,020 | 8,048 | 7,095 | 8,179 | 9,371 |
| 2015 | 5,128 | 3,469 | 394 | 3,111 | 7,345 | 5,456 | 6,038 | 7,190 | 8,066 | 8,876 | 8,052 | 5,604 |
| 2016 | 4,586 | 3,340 | 4,959 | 5,376 | 6,389 | 10,311 | 10,388 | 7,692 | 5,617 | 6,137 | 7,342 | 8,399 |
| 2017 | 2,398 | 80 | 4,818 | 6,939 | 10,242 | 10,875 | 8,415 | 10,950 | 10,377 | 8,384 | 9,480 | 9,184 |
| 2018 | 7,608 | 9,998 | 6,153 | 12,185 | 13,856 | 11,264 | 10,607 | 9,681 | 10,068 | 6,143 | 8,233 | 9,799 |
| 2019 | 7,193 | 6,929 | 8,018 | 9,718 | 9,622 | 11,794 | 13,244 | 12,403 | 9,267 | 10,069 | 13,630 | 14,124 |
| 2020 | 10,454 | 6,126 | 6,288 | 7,935 | 3,558 | 5,745 | 11,015 | 11,669 | 8,082 | 6,587 | 6,398 | 2,701 |
| 2021 | 3,798 | 5,598 | 7,298 | 16 | 8,137 | 9,445 | 11,472 | 10,250 | 3,753 | 7,471 | 12,272 | 11,022 |
| 2022 | 4,250 | 2,962 | 4,865 | 9,908 | 5,824 | 9,013 | 9,613 | 8,091 | 8,695 | 7,509 | 5,799 | 6,712 |
| 2023 | 8,239 | 7,176 | 6,289 | 10,353 | 10,249 | 6,585 | 7,451 | 7,900 | 4,229 | 6,332 | 9,543 | 9,558 |
| 2024 | 7,182 | |||||||||||
| - = No Data Reported; -- = Not Applicable; NA = Not Available; W = Withheld to avoid disclosure of individual company data. |
| Release Date: 3/29/2024 |
| Next Release Date: 4/30/2024 |