|
Download Data (XLS File) |
|
||||||||
|
||||||||
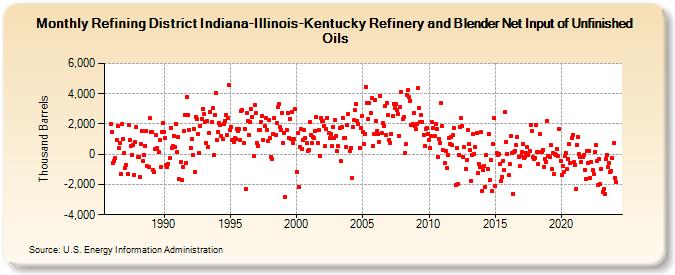
| Refining District Indiana-Illinois-Kentucky Refinery and Blender Net Input of Unfinished Oils (Thousand Barrels) | ||||||||
| Year | Jan | Feb | Mar | Apr | May | Jun | Jul | Aug | Sep | Oct | Nov | Dec |
|---|---|---|---|---|---|---|---|---|---|---|---|---|
| 1986 | 1,998 | 1,501 | -549 | -419 | -268 | 965 | 1,863 | 382 | 719 | -1,284 | 1,969 | 1,028 |
| 1987 | 77 | -893 | -682 | -1,313 | 1,924 | 932 | 544 | -32 | 613 | -1,370 | 806 | 1,782 |
| 1988 | -214 | -192 | -1,476 | 682 | 1,537 | -479 | -25 | 561 | 1,539 | -801 | -850 | 2,377 |
| 1989 | 1,447 | 1,482 | -1,060 | -1,172 | 316 | 1,249 | 391 | 133 | 944 | -822 | 1,497 | 2,076 |
| 1990 | 1,482 | 1,087 | -720 | -816 | -617 | -269 | 1,751 | 429 | 533 | 1,233 | 487 | 2,011 |
| 1991 | 163 | 1,116 | -1,659 | -546 | -1,693 | -850 | 1,510 | 2,619 | -589 | 3,793 | 2,578 | 1,633 |
| 1992 | 431 | 985 | -77 | 1,693 | -1,148 | 2,486 | 2,321 | 1,317 | 73 | 1,877 | 2,347 | 3,012 |
| 1993 | 2,692 | 2,138 | 725 | 2,182 | 477 | 1,404 | 2,798 | 2,121 | 3,034 | -29 | 2,626 | 4,029 |
| 1994 | 929 | 1,475 | 2,052 | 1,958 | 1,221 | 1,006 | 1,976 | 2,221 | 2,618 | 1,263 | 2,378 | 4,545 |
| 1995 | 1,580 | 1,797 | 931 | 781 | 1,057 | 1,010 | 1,678 | 1,513 | 1,650 | 930 | 2,887 | 2,940 |
| 1996 | 741 | 1,700 | -2,295 | 2,746 | 2,219 | 1,271 | 2,108 | 2,968 | 2,446 | -150 | 3,260 | 2,723 |
| 1997 | 737 | 553 | 1,599 | 1,600 | 2,134 | 2,548 | 949 | 1,864 | 2,421 | 1,593 | 896 | 2,236 |
| 1998 | 1,048 | -191 | -305 | 1,331 | 2,393 | 1,250 | 2,059 | 3,098 | 3,330 | 1,827 | 1,612 | 2,733 |
| 1999 | 728 | 1,401 | -2,814 | 1,605 | 2,753 | 1,105 | 2,317 | 990 | 2,787 | 716 | 989 | 3,017 |
| 2000 | -1,167 | 1,405 | -2,148 | 490 | 1,674 | 370 | 909 | 1,617 | 1,099 | 746 | 213 | 282 |
| 2001 | 2,112 | 1,294 | 727 | 1,129 | 1,068 | 1,542 | 2,459 | 748 | 1,591 | -106 | 2,367 | 2,211 |
| 2002 | 2,168 | 1,898 | 517 | 1,695 | 2,424 | 1,384 | 1,054 | 1,325 | 531 | 1,769 | 1,101 | 2,278 |
| 2003 | 1,177 | 193 | 516 | 1,729 | -475 | 1,768 | 2,423 | 1,096 | 1,090 | 487 | 1,921 | 2,629 |
| 2004 | 189 | 419 | -1,548 | 1,791 | 2,234 | 2,896 | 3,294 | 2,206 | 2,017 | 389 | 1,749 | 2,514 |
| 2005 | 1,458 | 685 | 1,351 | 4,456 | 3,391 | 2,327 | 3,374 | 2,728 | 3,706 | 570 | 1,359 | 3,585 |
| 2006 | 2,208 | 1,554 | 1,318 | 826 | 3,845 | 1,386 | 2,074 | 1,891 | 3,182 | 1,241 | 3,377 | 2,599 |
| 2007 | 924 | 755 | 1,344 | 2,508 | 3,306 | 3,033 | 3,314 | 2,916 | 2,631 | 1,233 | 3,127 | 4,084 |
| 2008 | 2,340 | 2,440 | 48 | 658 | 3,883 | 4,225 | 3,751 | 3,549 | 1,923 | 1,992 | 2,718 | 1,843 |
| 2009 | 1,641 | 2,005 | 4,391 | 3,050 | 2,134 | 2,566 | 2,160 | 1,273 | 542 | 1,694 | 1,740 | 1,366 |
| 2010 | 947 | 405 | 1,176 | 2,106 | 1,755 | 1,187 | 1,998 | 1,687 | -181 | 996 | 771 | 3,390 |
| 2011 | 1,864 | 273 | -570 | 240 | -908 | -68 | 1,060 | 702 | 1,149 | 609 | 1,263 | 1,703 |
| 2012 | -2,064 | 421 | -1,988 | -57 | 1,788 | 2,372 | 1,896 | -168 | 460 | -955 | -378 | 1,613 |
| 2013 | 671 | 266 | -1,801 | -80 | 1,339 | 31 | 474 | 1,389 | -1,270 | -622 | -828 | 1,459 |
| 2014 | -2,442 | -1,044 | -750 | -2,140 | -55 | -959 | 1,354 | -1,730 | -353 | -2,446 | 689 | 2,369 |
| 2015 | -2,113 | 91 | -21 | 20 | -657 | -1,780 | -1,500 | -432 | -1,070 | 2,761 | 800 | 36 |
| 2016 | -1,395 | -668 | 1,214 | 100 | -2,606 | 140 | 231 | 598 | 1,128 | -158 | -789 | -123 |
| 2017 | 127 | 689 | -243 | -167 | 65 | 457 | -63 | 201 | 1,962 | 1,541 | -199 | -330 |
| 2018 | -252 | 1,912 | 150 | -675 | 1,335 | 168 | 170 | 304 | -837 | -314 | -516 | 2,226 |
| 2019 | -90 | -160 | 595 | -957 | 57 | -1,329 | -4 | -64 | 338 | -122 | 1,679 | -422 |
| 2020 | -1,402 | -784 | -1,145 | -138 | 77 | -1,000 | -321 | 662 | -613 | 1,077 | 1,264 | -544 |
| 2021 | -701 | -2,269 | 624 | 1,160 | -12 | -176 | -499 | -181 | -74 | -1,032 | -1,647 | 202 |
| 2022 | -559 | 237 | -1,550 | -524 | -1,067 | -1,299 | 130 | 591 | -456 | -2,031 | -335 | -1,981 |
| 2023 | -960 | -2,511 | -2,325 | -2,641 | -335 | -77 | -844 | -594 | -1,160 | -1,116 | -282 | 758 |
| 2024 | -1,568 | |||||||||||
| - = No Data Reported; -- = Not Applicable; NA = Not Available; W = Withheld to avoid disclosure of individual company data. |
| Release Date: 3/29/2024 |
| Next Release Date: 4/30/2024 |