|
Download Data (XLS File) |
|
||||||||
|
||||||||
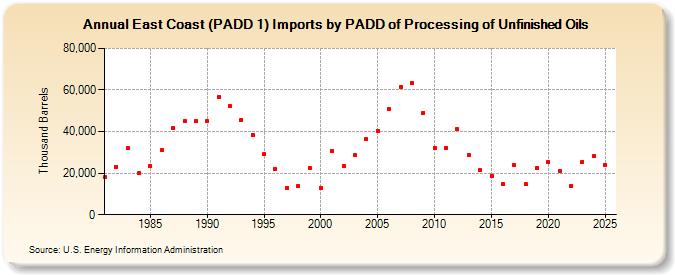
| East Coast (PADD 1) Imports by PADD of Processing of Unfinished Oils (Thousand Barrels) | ||||||||
| Decade | Year-0 | Year-1 | Year-2 | Year-3 | Year-4 | Year-5 | Year-6 | Year-7 | Year-8 | Year-9 |
|---|---|---|---|---|---|---|---|---|---|---|
| 1980's | 18,106 | 23,182 | 32,029 | 19,935 | 23,527 | 31,039 | 41,514 | 44,893 | 44,998 | |
| 1990's | 45,029 | 56,590 | 52,283 | 45,622 | 38,431 | 29,099 | 21,976 | 13,014 | 13,771 | 22,554 |
| 2000's | 13,056 | 30,599 | 23,316 | 28,534 | 36,316 | 40,393 | 50,649 | 61,494 | 63,367 | 49,092 |
| 2010's | 32,272 | 32,246 | 41,037 | 28,939 | 21,330 | 18,775 | 14,658 | 23,903 | 14,550 | 22,559 |
| 2020's | 25,313 | 21,114 | 13,891 | 25,651 |
| - = No Data Reported; -- = Not Applicable; NA = Not Available; W = Withheld to avoid disclosure of individual company data. |
| Release Date: 4/30/2024 |
| Next Release Date: 8/30/2024 |