|
Download Data (XLS File) |
|
||||||||
|
||||||||
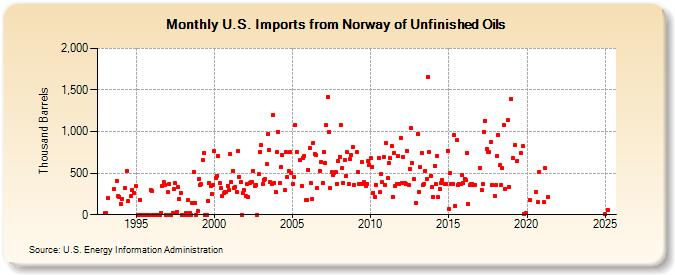
| U.S. Imports from Norway of Unfinished Oils (Thousand Barrels) | ||||||||
| Year | Jan | Feb | Mar | Apr | May | Jun | Jul | Aug | Sep | Oct | Nov | Dec |
|---|---|---|---|---|---|---|---|---|---|---|---|---|
| 1993 | 17 | 17 | 195 | 306 | 410 | 226 | 218 | |||||
| 1994 | 133 | 191 | 325 | 524 | 159 | 225 | 302 | 259 | ||||
| 1995 | 342 | 0 | 0 | 180 | 0 | 0 | 0 | 0 | 0 | 0 | 0 | 300 |
| 1996 | 289 | 0 | 0 | 0 | 0 | 0 | 0 | 21 | 346 | 392 | 358 | 0 |
| 1997 | 270 | 371 | 0 | 0 | 20 | 306 | 376 | 34 | 337 | 191 | 265 | 0 |
| 1998 | 0 | 0 | 21 | 0 | 173 | 20 | 0 | 138 | 518 | 142 | 0 | 41 |
| 1999 | 429 | 354 | 366 | 662 | 746 | 0 | 0 | 163 | 384 | 340 | 245 | 363 |
| 2000 | 763 | 443 | 465 | 704 | 385 | 321 | 225 | 258 | 271 | 274 | 351 | 294 |
| 2001 | 731 | 391 | 526 | 323 | 333 | 274 | 764 | 458 | 390 | 0 | 265 | 297 |
| 2002 | 223 | 375 | 217 | 381 | 389 | 395 | 528 | 350 | 361 | 0 | 486 | 757 |
| 2003 | 833 | 365 | 420 | 425 | 606 | 972 | 780 | 388 | 374 | 1,196 | 384 | 274 |
| 2004 | 753 | 998 | 385 | 571 | 713 | 303 | 751 | 451 | 523 | 760 | 505 | |
| 2005 | 371 | 451 | 1,074 | 756 | 653 | 350 | 679 | 704 | 181 | 173 | ||
| 2006 | 535 | 797 | 382 | 183 | 864 | 732 | 713 | 317 | 529 | 628 | 381 | |
| 2007 | 752 | 624 | 1,074 | 1,421 | 1,000 | 321 | 513 | 474 | 500 | 510 | 370 | 641 |
| 2008 | 700 | 1,076 | 560 | 381 | 663 | 465 | 750 | 367 | 667 | 715 | 820 | 363 |
| 2009 | 753 | 513 | 374 | 375 | 631 | 364 | 394 | 349 | 367 | 645 | 598 | |
| 2010 | 676 | 576 | 262 | 218 | 363 | 676 | 271 | 491 | 390 | 690 | 359 | |
| 2011 | 861 | 439 | 624 | 677 | 832 | 214 | 746 | 343 | 372 | 701 | 365 | 924 |
| 2012 | 382 | 689 | 378 | 367 | 767 | 359 | 554 | 1,038 | 619 | 431 | 140 | |
| 2013 | 976 | 279 | 568 | 746 | 360 | 368 | 531 | 435 | 1,654 | 749 | 465 | 329 |
| 2014 | 214 | 587 | 372 | 709 | 209 | 308 | 383 | 416 | 373 | 374 | 767 | |
| 2015 | 70 | 497 | 375 | 374 | 960 | 110 | 900 | 358 | 370 | 373 | 479 | 379 |
| 2016 | 434 | 412 | 747 | 134 | 352 | 369 | 370 | 353 | 361 | |||
| 2017 | 566 | 300 | 370 | 1,000 | 1,131 | 796 | 755 | 750 | 872 | 359 | 228 | |
| 2018 | 353 | 702 | 961 | 594 | 360 | 558 | 1,079 | 310 | 1,135 | 335 | ||
| 2019 | 1,392 | 680 | 836 | 641 | 742 | 822 | 14 | 15 | ||||
| 2020 | 181 | 272 | 147 | 516 | ||||||||
| 2021 | 151 | 556 | 209 | |||||||||
| - = No Data Reported; -- = Not Applicable; NA = Not Available; W = Withheld to avoid disclosure of individual company data. |
| Release Date: 3/29/2024 |
| Next Release Date: 4/30/2024 |