|
Download Data (XLS File) |
|
||||||||
|
||||||||
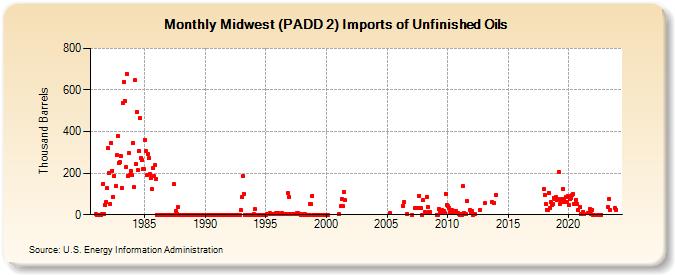
| Midwest (PADD 2) Imports of Unfinished Oils (Thousand Barrels) | ||||||||
| Year | Jan | Feb | Mar | Apr | May | Jun | Jul | Aug | Sep | Oct | Nov | Dec |
|---|---|---|---|---|---|---|---|---|---|---|---|---|
| 1981 | 2 | 0 | 0 | 1 | 0 | 1 | 2 | 150 | 2 | 49 | 62 | 127 |
| 1982 | 320 | 203 | 51 | 345 | 212 | 86 | 186 | 137 | 285 | 378 | 250 | 253 |
| 1983 | 282 | 130 | 539 | 640 | 548 | 228 | 677 | 187 | 297 | 193 | 212 | 189 |
| 1984 | 346 | 132 | 646 | 243 | 496 | 214 | 308 | 464 | 271 | 262 | 220 | 219 |
| 1985 | 360 | 306 | 189 | 292 | 271 | 197 | 176 | 124 | 223 | 185 | 238 | 170 |
| 1986 | 0 | 0 | 0 | 0 | 0 | 0 | 0 | 0 | 0 | 0 | 0 | 0 |
| 1987 | 0 | 0 | 0 | 0 | 1 | 146 | 0 | 20 | 5 | 36 | 0 | 0 |
| 1988 | 0 | 0 | 0 | 0 | 0 | 0 | 0 | 0 | 0 | 0 | 0 | 0 |
| 1989 | 0 | 0 | 0 | 0 | 0 | 0 | 0 | 0 | 0 | 0 | 0 | 0 |
| 1990 | 0 | 0 | 0 | 0 | 0 | 0 | 0 | 0 | 0 | 0 | 0 | 0 |
| 1991 | 0 | 0 | 0 | 0 | 0 | 0 | 0 | 0 | 0 | 0 | 0 | 0 |
| 1992 | 0 | 0 | 0 | 0 | 0 | 0 | 0 | 0 | 0 | 0 | 0 | 22 |
| 1993 | 83 | 185 | 102 | 0 | 0 | 0 | 0 | 0 | 0 | 0 | 0 | 0 |
| 1994 | 3 | 26 | 0 | 0 | 0 | 0 | 0 | 0 | 0 | 0 | 0 | 0 |
| 1995 | 1 | 4 | 3 | 4 | 7 | 5 | 5 | 2 | 5 | 3 | 6 | 4 |
| 1996 | 9 | 2 | 3 | 5 | 6 | 4 | 3 | 4 | 3 | 4 | 103 | 84 |
| 1997 | 4 | 5 | 5 | 3 | 4 | 4 | 5 | 6 | 6 | 2 | 3 | 1 |
| 1998 | 0 | 1 | 2 | 2 | 1 | 1 | 1 | 1 | 51 | 50 | 92 | 0 |
| 1999 | 0 | 0 | 1 | 1 | 0 | 0 | 0 | 1 | 1 | 1 | ||
| 2000 | 1 | 1 | ||||||||||
| 2001 | 2 | 40 | 74 | 40 | 110 | 70 | ||||||
| 2005 | 6 | |||||||||||
| 2006 | 44 | 62 | 2 | |||||||||
| 2007 | 1 | 31 | 31 | 30 | 92 | 30 | 31 | 1 | ||||
| 2008 | 69 | 14 | 86 | 38 | 14 | 15 | ||||||
| 2009 | 1 | 1 | 28 | 17 | 12 | 25 | 8 | 19 | 9 | 101 | 49 | |
| 2010 | 44 | 34 | 11 | 17 | 21 | 11 | 6 | 16 | 17 | 8 | 8 | 3 |
| 2011 | 1 | 2 | 1 | 136 | 9 | 3 | 2 | 67 | 23 | 15 | ||
| 2012 | 19 | 1 | 3 | 2 | 24 | |||||||
| 2013 | 55 | 61 | 56 | |||||||||
| 2014 | 94 | |||||||||||
| 2017 | 123 | |||||||||||
| 2018 | 96 | 50 | 24 | 22 | 106 | 34 | 60 | 45 | 53 | 82 | 74 | 85 |
| 2019 | 70 | 77 | 207 | 50 | 59 | 76 | 125 | 74 | 59 | 86 | 62 | 88 |
| 2020 | 49 | 77 | 78 | 93 | 100 | 51 | 71 | 53 | 22 | 36 | ||
| 2021 | 4 | 3 | 14 | 2 | 10 | 7 | 27 | 3 | 23 | |||
| 2022 | 0 | 0 | 0 | 0 | 0 | 0 | ||||||
| 2023 | 36 | 77 | 22 | 31 | 24 | |||||||
| - = No Data Reported; -- = Not Applicable; NA = Not Available; W = Withheld to avoid disclosure of individual company data. |
| Release Date: 3/29/2024 |
| Next Release Date: 4/30/2024 |