|
Download Data (XLS File) |
|
||||||||
|
||||||||
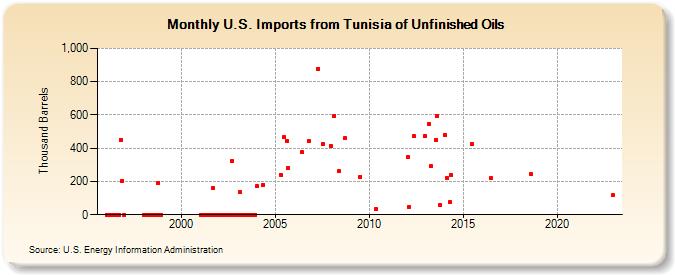
| U.S. Imports from Tunisia of Unfinished Oils (Thousand Barrels) | ||||||||
| Year | Jan | Feb | Mar | Apr | May | Jun | Jul | Aug | Sep | Oct | Nov | Dec |
|---|---|---|---|---|---|---|---|---|---|---|---|---|
| 1996 | 0 | 0 | 0 | 0 | 0 | 0 | 0 | 0 | 0 | 451 | 203 | 0 |
| 1998 | 0 | 0 | 0 | 0 | 0 | 0 | 0 | 0 | 0 | 191 | 0 | 0 |
| 2001 | 0 | 0 | 0 | 0 | 0 | 0 | 0 | 0 | 163 | 0 | 0 | 0 |
| 2002 | 0 | 0 | 0 | 0 | 0 | 0 | 0 | 0 | 325 | 0 | 0 | 0 |
| 2003 | 0 | 135 | 0 | 0 | 0 | 0 | 0 | 0 | 0 | 0 | 0 | 0 |
| 2004 | 171 | 181 | ||||||||||
| 2005 | 241 | 467 | 445 | 280 | ||||||||
| 2006 | 375 | 443 | ||||||||||
| 2007 | 878 | 423 | 413 | |||||||||
| 2008 | 591 | 261 | 459 | |||||||||
| 2009 | 229 | |||||||||||
| 2010 | 32 | |||||||||||
| 2012 | 345 | 48 | 471 | 472 | ||||||||
| 2013 | 548 | 291 | 449 | 595 | 59 | |||||||
| 2014 | 481 | 223 | 74 | 240 | ||||||||
| 2015 | 424 | |||||||||||
| 2016 | 218 | |||||||||||
| 2018 | 242 | |||||||||||
| 2022 | 116 | |||||||||||
| - = No Data Reported; -- = Not Applicable; NA = Not Available; W = Withheld to avoid disclosure of individual company data. |
| Release Date: 8/30/2024 |
| Next Release Date: 9/30/2024 |