|
Download Data (XLS File) |
|
||||||||
|
||||||||
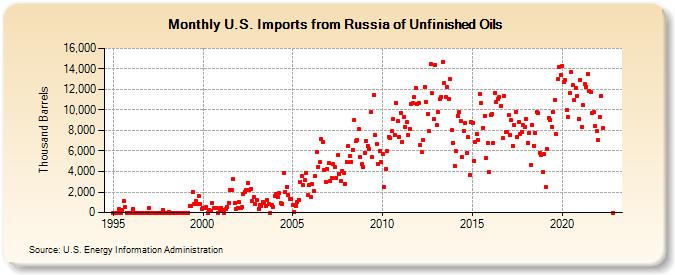
| U.S. Imports from Russia of Unfinished Oils (Thousand Barrels) | ||||||||
| Year | Jan | Feb | Mar | Apr | May | Jun | Jul | Aug | Sep | Oct | Nov | Dec |
|---|---|---|---|---|---|---|---|---|---|---|---|---|
| 1995 | 0 | 0 | 0 | 0 | 367 | 0 | 254 | 1,158 | 538 | 0 | 0 | 0 |
| 1996 | 0 | 394 | 0 | 0 | 0 | 0 | 0 | 0 | 0 | 0 | 0 | 0 |
| 1997 | 439 | 0 | 0 | 0 | 0 | 0 | 0 | 0 | 0 | 232 | 0 | 0 |
| 1998 | 0 | 94 | 0 | 0 | 0 | 0 | 0 | 0 | 0 | 0 | 0 | 0 |
| 1999 | 0 | 0 | 0 | 615 | 641 | 2,050 | 833 | 1,163 | 858 | 1,617 | 797 | 335 |
| 2000 | 457 | 441 | 512 | 0 | 250 | 189 | 965 | 447 | 468 | 444 | 0 | 170 |
| 2001 | 493 | 264 | 0 | 350 | 583 | 969 | 2,166 | 2,191 | 3,247 | 966 | 373 | 425 |
| 2002 | 993 | 440 | 563 | 1,848 | 2,034 | 2,179 | 2,868 | 2,228 | 2,287 | 1,102 | 1,534 | 799 |
| 2003 | 1,187 | 337 | 732 | 637 | 1,051 | 907 | 636 | 1,192 | 804 | 0 | 702 | 540 |
| 2004 | 1,608 | 1,801 | 1,555 | 1,860 | 885 | 853 | 3,859 | 2,025 | 2,497 | 1,714 | 1,330 | 1,295 |
| 2005 | 764 | 78 | 684 | 1,025 | 1,240 | 2,972 | 3,543 | 2,657 | 3,158 | 3,895 | 1,684 | 2,657 |
| 2006 | 1,487 | 2,746 | 2,120 | 3,533 | 5,946 | 4,453 | 4,898 | 7,176 | 6,886 | 4,134 | 2,985 | 4,221 |
| 2007 | 4,811 | 3,095 | 3,352 | 4,708 | 4,435 | 3,375 | 5,609 | 3,758 | 3,058 | 4,097 | 3,834 | 2,751 |
| 2008 | 4,887 | 6,447 | 5,558 | 4,951 | 6,099 | 9,005 | 6,949 | 7,111 | 8,103 | 5,399 | 4,712 | 4,416 |
| 2009 | 5,834 | 6,997 | 6,521 | 6,209 | 9,783 | 5,432 | 11,473 | 7,557 | 6,729 | 4,769 | 6,028 | 4,904 |
| 2010 | 5,675 | 2,464 | 4,222 | 5,967 | 7,347 | 7,251 | 7,918 | 9,151 | 7,558 | 10,666 | 8,877 | 7,398 |
| 2011 | 9,711 | 6,879 | 9,311 | 8,369 | 8,786 | 7,559 | 8,125 | 10,564 | 10,714 | 11,222 | 12,154 | 10,607 |
| 2012 | 10,681 | 6,630 | 5,924 | 7,057 | 12,266 | 10,784 | 9,627 | 7,906 | 14,444 | 11,608 | 9,117 | 14,359 |
| 2013 | 8,502 | 9,825 | 11,079 | 11,236 | 14,632 | 12,611 | 11,218 | 12,271 | 11,078 | 12,998 | 8,003 | 6,770 |
| 2014 | 4,580 | 5,958 | 9,449 | 9,807 | 8,884 | 5,375 | 7,946 | 8,680 | 5,778 | 7,333 | 3,645 | 8,850 |
| 2015 | 8,725 | 5,026 | 6,913 | 7,677 | 7,071 | 11,588 | 10,688 | 8,261 | 9,446 | 5,316 | 6,770 | 3,943 |
| 2016 | 9,513 | 9,607 | 6,801 | 11,700 | 10,792 | 11,056 | 11,258 | 10,384 | 7,225 | 11,403 | 7,871 | 7,861 |
| 2017 | 9,490 | 7,593 | 8,994 | 6,514 | 8,547 | 9,829 | 7,358 | 8,809 | 7,678 | 7,833 | 8,489 | 8,314 |
| 2018 | 9,140 | 6,768 | 7,756 | 4,676 | 8,582 | 6,520 | 7,706 | 9,752 | 9,665 | 5,834 | 5,587 | 3,908 |
| 2019 | 5,696 | 2,510 | 6,168 | 9,228 | 9,004 | 8,377 | 9,794 | 10,988 | 7,625 | 13,048 | 14,156 | 13,390 |
| 2020 | 14,291 | 12,728 | 12,928 | 9,965 | 9,351 | 11,635 | 13,711 | 12,390 | 10,931 | 12,172 | 11,342 | 9,098 |
| 2021 | 12,957 | 8,356 | 10,453 | 12,576 | 12,283 | 13,547 | 11,882 | 11,715 | 9,662 | 9,818 | 8,397 | 7,923 |
| 2022 | 7,055 | 9,336 | 11,376 | 8,232 | 0 | |||||||
| - = No Data Reported; -- = Not Applicable; NA = Not Available; W = Withheld to avoid disclosure of individual company data. |
| Release Date: 3/29/2024 |
| Next Release Date: 4/30/2024 |