|
Download Data (XLS File) |
|
||||||||
|
||||||||
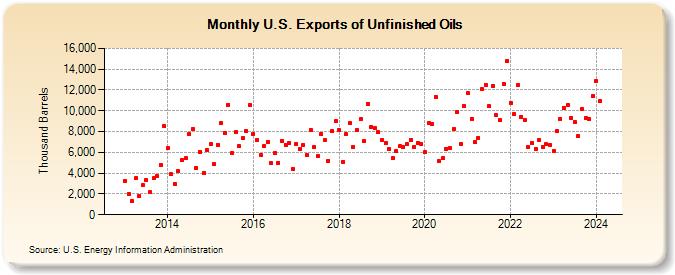
| U.S. Exports of Unfinished Oils (Thousand Barrels) | ||||||||
| Year | Jan | Feb | Mar | Apr | May | Jun | Jul | Aug | Sep | Oct | Nov | Dec |
|---|---|---|---|---|---|---|---|---|---|---|---|---|
| 2013 | 3,245 | 1,994 | 1,302 | 3,489 | 1,795 | 2,856 | 3,295 | 2,138 | 3,502 | 3,688 | 4,798 | 8,491 |
| 2014 | 6,377 | 3,892 | 2,994 | 4,161 | 5,307 | 5,411 | 7,744 | 8,246 | 4,494 | 6,059 | 4,023 | 6,215 |
| 2015 | 6,782 | 4,869 | 6,731 | 8,839 | 7,904 | 10,590 | 5,937 | 7,917 | 6,581 | 7,333 | 8,067 | 10,549 |
| 2016 | 7,747 | 7,164 | 5,775 | 6,615 | 7,018 | 4,935 | 5,946 | 5,004 | 7,135 | 6,723 | 6,908 | 4,373 |
| 2017 | 6,811 | 6,274 | 6,730 | 5,728 | 8,138 | 6,498 | 5,629 | 7,740 | 7,142 | 5,210 | 8,035 | 9,014 |
| 2018 | 8,116 | 5,107 | 7,738 | 8,813 | 6,531 | 8,166 | 9,203 | 7,082 | 10,690 | 8,438 | 8,334 | 7,910 |
| 2019 | 7,197 | 6,890 | 6,354 | 5,421 | 6,113 | 6,573 | 6,494 | 6,759 | 7,197 | 6,540 | 6,901 | 6,788 |
| 2020 | 5,988 | 8,810 | 8,740 | 11,366 | 5,142 | 5,413 | 6,357 | 6,371 | 8,264 | 9,871 | 6,824 | 10,442 |
| 2021 | 11,731 | 9,244 | 6,955 | 7,415 | 12,089 | 12,515 | 10,424 | 12,374 | 9,556 | 9,088 | 12,615 | 14,759 |
| 2022 | 10,776 | 9,669 | 12,477 | 9,446 | 9,137 | 6,501 | 6,902 | 6,338 | 7,180 | 6,515 | 6,775 | 6,743 |
| 2023 | 6,117 | 8,054 | 9,197 | 10,301 | 10,555 | 9,314 | 8,904 | 7,556 | 10,161 | 9,308 | 9,192 | 11,434 |
| 2024 | 12,846 | |||||||||||
| - = No Data Reported; -- = Not Applicable; NA = Not Available; W = Withheld to avoid disclosure of individual company data. |
| Release Date: 3/29/2024 |
| Next Release Date: 4/30/2024 |