|
Download Data (XLS File) |
|
||||||||
|
||||||||
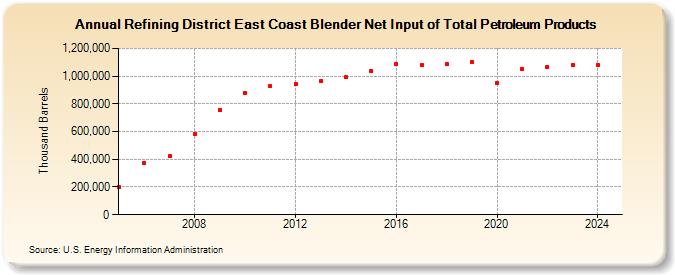
| Refining District East Coast Blender Net Input of Total Petroleum Products (Thousand Barrels) | ||||||||
| Decade | Year-0 | Year-1 | Year-2 | Year-3 | Year-4 | Year-5 | Year-6 | Year-7 | Year-8 | Year-9 |
|---|---|---|---|---|---|---|---|---|---|---|
| 2000's | 199,173 | 371,134 | 420,199 | 585,797 | 758,895 | |||||
| 2010's | 879,536 | 925,330 | 939,525 | 964,892 | 990,619 | 1,037,575 | 1,083,993 | 1,082,092 | 1,084,433 | 1,099,406 |
| 2020's | 947,219 | 1,050,641 | 1,068,189 | 1,079,291 |
| - = No Data Reported; -- = Not Applicable; NA = Not Available; W = Withheld to avoid disclosure of individual company data. |
| Release Date: 3/29/2024 |
| Next Release Date: 8/30/2024 |