|
Download Data (XLS File) |
|
||||||||
|
||||||||
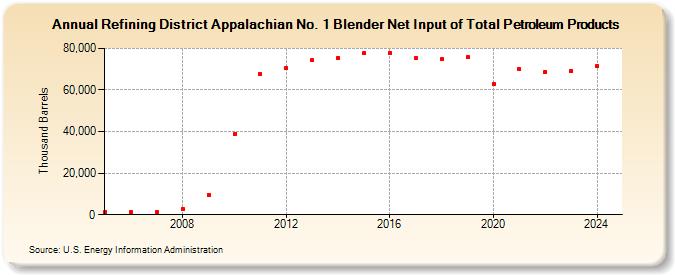
| Refining District Appalachian No. 1 Blender Net Input of Total Petroleum Products (Thousand Barrels) | ||||||||
| Decade | Year-0 | Year-1 | Year-2 | Year-3 | Year-4 | Year-5 | Year-6 | Year-7 | Year-8 | Year-9 |
|---|---|---|---|---|---|---|---|---|---|---|
| 2000's | 1,285 | 1,254 | 1,281 | 2,749 | 9,488 | |||||
| 2010's | 38,654 | 67,701 | 70,623 | 74,270 | 75,580 | 77,660 | 77,807 | 75,409 | 74,844 | 75,622 |
| 2020's | 63,059 | 69,899 | 68,684 | 68,654 |
| - = No Data Reported; -- = Not Applicable; NA = Not Available; W = Withheld to avoid disclosure of individual company data. |
| Release Date: 3/29/2024 |
| Next Release Date: 8/30/2024 |