|
Download Data (XLS File) |
|
||||||||
|
||||||||
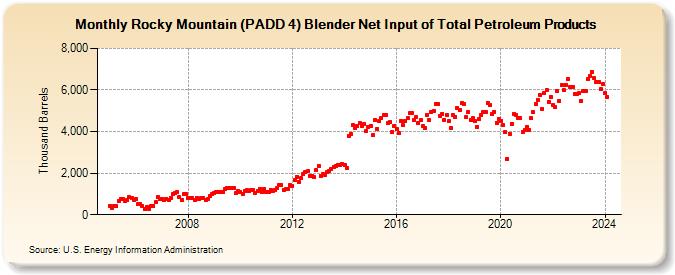
| Rocky Mountain (PADD 4) Blender Net Input of Total Petroleum Products (Thousand Barrels) | ||||||||
| Year | Jan | Feb | Mar | Apr | May | Jun | Jul | Aug | Sep | Oct | Nov | Dec |
|---|---|---|---|---|---|---|---|---|---|---|---|---|
| 2005 | 440 | 335 | 396 | 400 | 680 | 771 | 778 | 653 | 689 | 832 | 816 | 729 |
| 2006 | 734 | 506 | 532 | 410 | 263 | 380 | 297 | 397 | 409 | 588 | 850 | 766 |
| 2007 | 751 | 692 | 775 | 692 | 826 | 1,009 | 1,058 | 1,088 | 839 | 709 | 988 | 1,006 |
| 2008 | 802 | 806 | 811 | 719 | 804 | 753 | 790 | 816 | 702 | 761 | 889 | 1,007 |
| 2009 | 1,047 | 1,075 | 1,116 | 1,072 | 1,107 | 1,214 | 1,292 | 1,299 | 1,281 | 1,300 | 1,037 | 1,130 |
| 2010 | 1,084 | 1,009 | 1,134 | 1,173 | 1,138 | 1,179 | 1,179 | 1,062 | 1,150 | 1,257 | 1,110 | 1,247 |
| 2011 | 1,084 | 1,081 | 1,206 | 1,119 | 1,203 | 1,285 | 1,424 | 1,429 | 1,206 | 1,215 | 1,229 | 1,416 |
| 2012 | 1,392 | 1,665 | 1,828 | 1,588 | 1,748 | 1,946 | 2,053 | 2,088 | 1,863 | 1,850 | 1,791 | 2,152 |
| 2013 | 2,350 | 1,871 | 1,952 | 1,891 | 2,036 | 2,094 | 2,199 | 2,301 | 2,356 | 2,396 | 2,406 | 2,432 |
| 2014 | 2,396 | 2,229 | 3,791 | 3,892 | 4,303 | 4,148 | 4,261 | 4,389 | 4,285 | 4,357 | 4,022 | 4,196 |
| 2015 | 4,269 | 3,818 | 4,549 | 4,146 | 4,492 | 4,662 | 4,792 | 4,810 | 4,397 | 4,457 | 3,982 | 4,285 |
| 2016 | 4,103 | 3,911 | 4,529 | 4,306 | 4,506 | 4,630 | 4,875 | 4,911 | 4,576 | 4,694 | 4,404 | 4,538 |
| 2017 | 4,248 | 4,184 | 4,799 | 4,556 | 4,940 | 4,977 | 5,329 | 5,309 | 4,764 | 4,860 | 4,545 | 4,815 |
| 2018 | 4,492 | 4,184 | 4,793 | 4,719 | 5,139 | 5,031 | 5,380 | 5,306 | 4,695 | 4,940 | 4,569 | 4,644 |
| 2019 | 4,506 | 4,238 | 4,623 | 4,780 | 4,951 | 4,932 | 5,385 | 5,256 | 4,825 | 4,961 | 4,434 | 4,596 |
| 2020 | 4,528 | 4,292 | 3,955 | 2,684 | 3,902 | 4,385 | 4,857 | 4,791 | 4,675 | 4,636 | 3,996 | 4,066 |
| 2021 | 4,232 | 4,089 | 4,640 | 4,926 | 5,321 | 5,541 | 5,773 | 5,086 | 5,871 | 5,989 | 5,436 | 5,673 |
| 2022 | 5,286 | 5,159 | 5,933 | 5,485 | 6,234 | 5,997 | 6,258 | 6,527 | 6,121 | 6,157 | 5,794 | 5,824 |
| 2023 | 5,839 | 5,483 | 5,964 | 5,960 | 6,509 | 6,679 | 6,867 | 6,556 | 6,378 | 6,360 | 6,035 | 6,298 |
| 2024 | 5,854 | |||||||||||
| - = No Data Reported; -- = Not Applicable; NA = Not Available; W = Withheld to avoid disclosure of individual company data. |
| Release Date: 3/29/2024 |
| Next Release Date: 4/30/2024 |
Referring Pages: