|
Download Data (XLS File) |
|
||||||||
|
||||||||
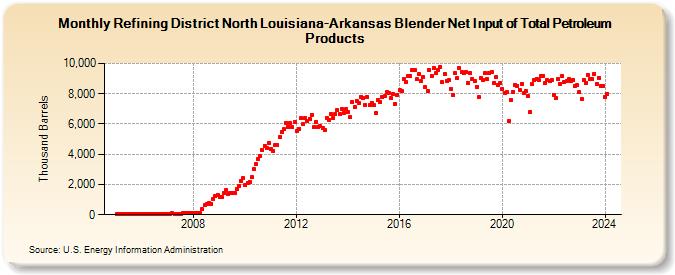
| Refining District North Louisiana-Arkansas Blender Net Input of Total Petroleum Products (Thousand Barrels) | ||||||||
| Year | Jan | Feb | Mar | Apr | May | Jun | Jul | Aug | Sep | Oct | Nov | Dec |
|---|---|---|---|---|---|---|---|---|---|---|---|---|
| 2005 | 43 | 34 | 59 | 39 | 35 | 34 | 30 | 32 | 39 | 52 | 30 | 29 |
| 2006 | 29 | 33 | 52 | 23 | 28 | 21 | 22 | 25 | 37 | 66 | 46 | 71 |
| 2007 | 68 | 72 | 91 | 62 | 68 | 52 | 69 | 88 | 105 | 139 | 143 | 140 |
| 2008 | 116 | 108 | 120 | 116 | 351 | 642 | 735 | 753 | 712 | 1,060 | 1,210 | 1,317 |
| 2009 | 1,170 | 1,161 | 1,457 | 1,620 | 1,395 | 1,451 | 1,407 | 1,431 | 1,708 | 1,920 | 2,235 | 2,401 |
| 2010 | 1,943 | 2,104 | 2,185 | 2,476 | 3,019 | 3,321 | 3,681 | 3,892 | 4,273 | 4,572 | 4,389 | 4,745 |
| 2011 | 4,332 | 4,234 | 4,599 | 4,602 | 5,144 | 5,482 | 5,638 | 6,085 | 5,817 | 6,040 | 5,785 | 6,139 |
| 2012 | 5,539 | 5,697 | 6,372 | 5,982 | 6,371 | 6,222 | 6,334 | 6,616 | 5,788 | 6,141 | 5,813 | 5,840 |
| 2013 | 5,734 | 5,617 | 6,421 | 6,293 | 6,633 | 6,403 | 6,686 | 6,895 | 6,649 | 7,006 | 6,735 | 6,989 |
| 2014 | 6,795 | 6,429 | 7,469 | 7,152 | 7,552 | 7,366 | 7,816 | 7,721 | 7,226 | 7,776 | 7,243 | 7,414 |
| 2015 | 7,231 | 6,711 | 7,584 | 7,439 | 7,765 | 7,818 | 8,105 | 8,075 | 7,696 | 7,966 | 7,324 | 7,925 |
| 2016 | 8,238 | 8,183 | 8,960 | 8,757 | 9,140 | 9,177 | 9,552 | 9,570 | 8,956 | 9,311 | 8,835 | 9,090 |
| 2017 | 8,442 | 8,182 | 9,595 | 9,190 | 9,698 | 9,345 | 9,553 | 9,754 | 8,750 | 9,307 | 8,871 | 8,907 |
| 2018 | 8,322 | 7,896 | 9,368 | 9,047 | 9,690 | 9,406 | 9,359 | 9,440 | 8,736 | 9,370 | 8,971 | 8,850 |
| 2019 | 8,467 | 7,759 | 9,036 | 8,907 | 9,363 | 8,947 | 9,344 | 9,440 | 8,742 | 9,106 | 8,602 | 8,728 |
| 2020 | 8,327 | 8,049 | 8,092 | 6,178 | 7,584 | 8,133 | 8,567 | 8,544 | 8,259 | 8,646 | 8,026 | 8,151 |
| 2021 | 7,818 | 6,800 | 8,611 | 8,907 | 8,996 | 8,886 | 9,143 | 9,198 | 8,732 | 8,895 | 8,815 | 8,933 |
| 2022 | 7,948 | 7,720 | 8,985 | 8,654 | 9,165 | 8,777 | 8,858 | 8,943 | 8,832 | 8,906 | 8,544 | 8,560 |
| 2023 | 8,082 | 7,680 | 8,937 | 8,720 | 9,247 | 8,941 | 9,003 | 9,331 | 8,652 | 9,024 | 8,510 | 8,480 |
| 2024 | 7,767 | |||||||||||
| - = No Data Reported; -- = Not Applicable; NA = Not Available; W = Withheld to avoid disclosure of individual company data. |
| Release Date: 3/29/2024 |
| Next Release Date: 4/30/2024 |