|
Download Data (XLS File) |
|
||||||||
|
||||||||
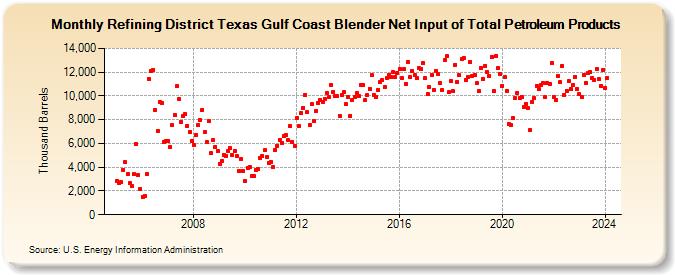
| Refining District Texas Gulf Coast Blender Net Input of Total Petroleum Products (Thousand Barrels) | ||||||||
| Year | Jan | Feb | Mar | Apr | May | Jun | Jul | Aug | Sep | Oct | Nov | Dec |
|---|---|---|---|---|---|---|---|---|---|---|---|---|
| 2005 | 2,855 | 2,640 | 2,716 | 3,764 | 4,409 | 3,395 | 2,631 | 2,444 | 3,394 | 5,919 | 3,328 | 2,176 |
| 2006 | 1,476 | 1,592 | 3,403 | 11,456 | 12,097 | 12,207 | 8,800 | 7,082 | 9,528 | 9,426 | 6,150 | 6,210 |
| 2007 | 6,196 | 5,709 | 7,520 | 8,387 | 10,828 | 9,753 | 7,794 | 8,331 | 8,448 | 7,505 | 6,970 | 6,234 |
| 2008 | 5,896 | 6,709 | 7,549 | 7,965 | 8,848 | 6,922 | 6,086 | 7,886 | 5,166 | 6,289 | 5,737 | 5,379 |
| 2009 | 4,296 | 4,551 | 5,040 | 4,980 | 5,404 | 5,608 | 5,009 | 5,350 | 4,935 | 3,711 | 4,692 | 3,721 |
| 2010 | 2,817 | 3,937 | 4,015 | 3,240 | 3,290 | 3,761 | 3,864 | 4,792 | 4,931 | 5,407 | 4,864 | 4,353 |
| 2011 | 4,454 | 3,991 | 5,464 | 5,817 | 6,309 | 6,058 | 6,612 | 6,670 | 6,267 | 7,454 | 6,142 | 5,777 |
| 2012 | 8,122 | 7,434 | 8,555 | 9,019 | 10,067 | 8,635 | 7,556 | 9,305 | 7,864 | 8,745 | 9,415 | 9,664 |
| 2013 | 9,524 | 9,708 | 10,230 | 9,936 | 10,938 | 10,291 | 10,018 | 9,963 | 8,334 | 10,058 | 10,325 | 9,279 |
| 2014 | 9,940 | 8,338 | 9,675 | 9,931 | 10,256 | 9,993 | 10,920 | 10,894 | 9,617 | 10,080 | 10,606 | 11,729 |
| 2015 | 10,076 | 9,880 | 10,510 | 11,160 | 11,316 | 10,766 | 11,506 | 11,785 | 11,595 | 11,983 | 11,607 | 11,950 |
| 2016 | 12,293 | 11,518 | 12,235 | 11,035 | 12,873 | 11,576 | 12,083 | 11,719 | 11,490 | 12,321 | 12,233 | 12,759 |
| 2017 | 11,478 | 10,141 | 10,775 | 11,775 | 10,519 | 12,097 | 11,874 | 11,058 | 10,493 | 12,996 | 13,342 | 10,299 |
| 2018 | 11,236 | 10,384 | 12,633 | 11,168 | 11,720 | 13,147 | 13,222 | 11,341 | 11,577 | 12,869 | 11,698 | 11,800 |
| 2019 | 11,066 | 10,388 | 12,333 | 11,451 | 12,531 | 12,016 | 11,678 | 13,287 | 10,396 | 13,369 | 12,364 | 11,828 |
| 2020 | 10,857 | 11,587 | 10,450 | 7,651 | 7,531 | 8,125 | 9,809 | 10,247 | 9,823 | 9,941 | 9,077 | 9,352 |
| 2021 | 8,956 | 7,117 | 9,522 | 9,800 | 10,848 | 10,562 | 10,919 | 11,074 | 9,868 | 11,086 | 11,030 | 12,737 |
| 2022 | 9,897 | 9,686 | 11,717 | 11,166 | 12,543 | 10,116 | 10,455 | 11,236 | 10,600 | 10,945 | 11,616 | 10,622 |
| 2023 | 10,129 | 9,910 | 11,762 | 11,096 | 11,908 | 12,008 | 11,531 | 11,380 | 12,248 | 11,435 | 10,864 | 12,201 |
| 2024 | 10,674 | |||||||||||
| - = No Data Reported; -- = Not Applicable; NA = Not Available; W = Withheld to avoid disclosure of individual company data. |
| Release Date: 3/29/2024 |
| Next Release Date: 4/30/2024 |