|
Download Data (XLS File) |
|
||||||||
|
||||||||
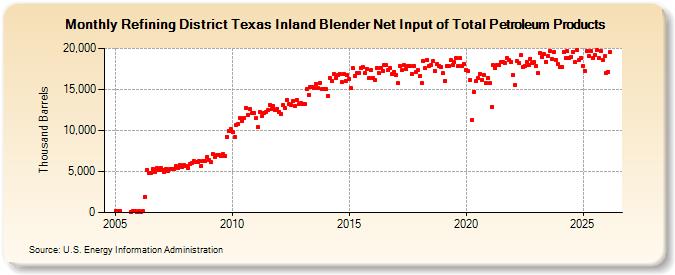
| Refining District Texas Inland Blender Net Input of Total Petroleum Products (Thousand Barrels) | ||||||||
| Year | Jan | Feb | Mar | Apr | May | Jun | Jul | Aug | Sep | Oct | Nov | Dec |
|---|---|---|---|---|---|---|---|---|---|---|---|---|
| 2005 | 193 | 175 | 181 | 82 | 150 | 191 | 108 | |||||
| 2006 | 148 | 100 | 154 | 1,935 | 5,185 | 4,851 | 4,762 | 5,346 | 5,000 | 5,370 | 5,144 | 5,441 |
| 2007 | 5,145 | 4,985 | 5,359 | 5,028 | 5,303 | 5,333 | 5,327 | 5,629 | 5,421 | 5,748 | 5,512 | 5,776 |
| 2008 | 5,730 | 5,478 | 5,939 | 5,991 | 6,309 | 6,165 | 6,122 | 6,266 | 5,709 | 6,299 | 6,221 | 6,769 |
| 2009 | 6,429 | 6,103 | 7,139 | 6,818 | 6,997 | 7,027 | 6,915 | 7,119 | 6,835 | 9,240 | 9,892 | 10,194 |
| 2010 | 9,825 | 9,222 | 10,649 | 10,775 | 11,542 | 11,198 | 11,551 | 12,744 | 11,886 | 12,584 | 12,091 | 12,149 |
| 2011 | 11,467 | 10,413 | 12,259 | 11,713 | 12,167 | 12,219 | 12,445 | 13,098 | 12,594 | 12,935 | 12,454 | 12,656 |
| 2012 | 12,270 | 11,999 | 13,121 | 12,737 | 13,694 | 13,210 | 13,136 | 13,598 | 12,954 | 13,732 | 13,167 | 13,291 |
| 2013 | 13,169 | 13,170 | 15,038 | 14,374 | 15,335 | 15,293 | 15,214 | 15,684 | 15,118 | 15,801 | 15,007 | 15,040 |
| 2014 | 15,015 | 14,202 | 16,398 | 15,982 | 16,930 | 16,449 | 16,755 | 16,934 | 15,918 | 16,854 | 16,056 | 16,702 |
| 2015 | 16,252 | 15,132 | 17,573 | 16,654 | 16,999 | 17,062 | 17,555 | 17,703 | 16,998 | 17,522 | 16,409 | 17,312 |
| 2016 | 16,428 | 16,164 | 17,655 | 16,975 | 17,643 | 17,224 | 17,997 | 17,933 | 17,357 | 17,633 | 16,871 | 17,167 |
| 2017 | 16,756 | 15,754 | 17,885 | 17,334 | 17,941 | 17,432 | 17,891 | 17,873 | 16,931 | 17,894 | 17,076 | 17,379 |
| 2018 | 16,634 | 15,748 | 18,411 | 17,568 | 18,597 | 17,861 | 17,965 | 18,426 | 17,217 | 18,047 | 17,865 | 17,778 |
| 2019 | 16,948 | 16,049 | 17,795 | 17,816 | 18,550 | 17,999 | 18,358 | 18,877 | 17,865 | 18,774 | 17,825 | 18,049 |
| 2020 | 17,414 | 17,212 | 16,129 | 11,276 | 14,743 | 15,972 | 16,392 | 16,926 | 16,180 | 16,782 | 15,740 | 16,372 |
| 2021 | 15,745 | 12,917 | 17,927 | 17,669 | 17,922 | 17,947 | 18,366 | 18,390 | 18,170 | 18,802 | 18,532 | 18,372 |
| 2022 | 16,748 | 15,533 | 18,442 | 18,198 | 19,159 | 17,737 | 17,825 | 18,359 | 17,983 | 18,739 | 18,174 | 18,372 |
| 2023 | 17,757 | 16,866 | 19,393 | 19,007 | 19,282 | 18,490 | 19,043 | 19,685 | 18,723 | 19,587 | 18,621 | 18,050 |
| 2024 | 17,728 | |||||||||||
| - = No Data Reported; -- = Not Applicable; NA = Not Available; W = Withheld to avoid disclosure of individual company data. |
| Release Date: 3/29/2024 |
| Next Release Date: 4/30/2024 |