|
Download Data (XLS File) |
|
||||||||
|
||||||||
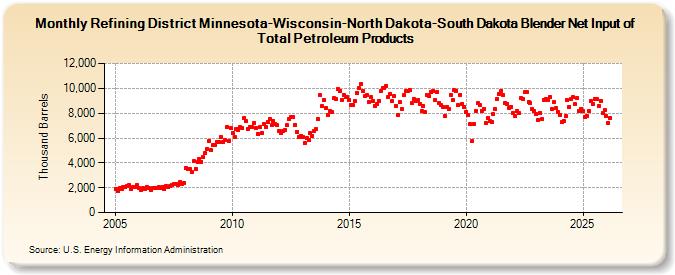
| Refining District Minnesota-Wisconsin-North Dakota-South Dakota Blender Net Input of Total Petroleum Products (Thousand Barrels) | ||||||||
| Year | Jan | Feb | Mar | Apr | May | Jun | Jul | Aug | Sep | Oct | Nov | Dec |
|---|---|---|---|---|---|---|---|---|---|---|---|---|
| 2005 | 1,919 | 1,744 | 1,954 | 1,864 | 2,039 | 2,057 | 2,135 | 2,214 | 1,859 | 2,029 | 2,019 | 2,208 |
| 2006 | 1,951 | 1,854 | 1,943 | 1,899 | 2,075 | 1,992 | 1,830 | 2,001 | 2,014 | 2,008 | 2,056 | 1,995 |
| 2007 | 2,045 | 1,879 | 2,125 | 2,032 | 2,131 | 2,241 | 2,261 | 2,332 | 2,179 | 2,421 | 2,316 | 2,415 |
| 2008 | 3,616 | 3,484 | 3,472 | 3,234 | 4,130 | 3,543 | 4,061 | 4,329 | 4,094 | 4,471 | 4,761 | 5,128 |
| 2009 | 5,764 | 4,996 | 5,457 | 5,413 | 5,671 | 5,650 | 6,075 | 5,674 | 5,806 | 6,865 | 5,743 | 6,794 |
| 2010 | 6,424 | 6,072 | 6,764 | 6,606 | 6,861 | 6,781 | 7,611 | 7,348 | 6,754 | 6,890 | 6,883 | 7,232 |
| 2011 | 6,803 | 6,355 | 6,874 | 6,429 | 7,145 | 6,892 | 7,280 | 7,534 | 7,020 | 7,374 | 7,116 | 7,017 |
| 2012 | 6,594 | 6,370 | 6,530 | 6,682 | 7,009 | 7,519 | 7,676 | 7,722 | 7,078 | 6,514 | 6,066 | 6,199 |
| 2013 | 6,081 | 5,593 | 5,990 | 5,846 | 6,408 | 6,166 | 6,595 | 6,695 | 7,503 | 9,440 | 8,548 | 9,079 |
| 2014 | 8,387 | 7,840 | 8,189 | 8,078 | 9,195 | 9,121 | 9,954 | 9,784 | 9,064 | 9,495 | 9,308 | 9,292 |
| 2015 | 9,080 | 8,679 | 8,648 | 9,000 | 9,652 | 10,001 | 10,354 | 9,812 | 9,349 | 9,448 | 8,920 | 9,270 |
| 2016 | 8,984 | 8,609 | 8,703 | 9,004 | 9,804 | 10,021 | 10,012 | 10,196 | 9,336 | 9,558 | 8,997 | 9,364 |
| 2017 | 8,572 | 7,854 | 8,895 | 8,344 | 9,460 | 9,761 | 9,781 | 9,901 | 8,793 | 9,159 | 9,004 | 9,032 |
| 2018 | 8,762 | 8,186 | 8,564 | 8,063 | 9,501 | 9,371 | 9,736 | 9,786 | 9,024 | 9,719 | 8,832 | 8,636 |
| 2019 | 8,465 | 7,746 | 8,507 | 8,348 | 9,494 | 9,024 | 9,844 | 9,819 | 8,641 | 9,494 | 8,739 | 8,524 |
| 2020 | 8,132 | 7,850 | 7,120 | 5,796 | 7,136 | 8,146 | 8,789 | 8,633 | 8,202 | 8,326 | 7,209 | 7,602 |
| 2021 | 7,410 | 7,263 | 7,909 | 8,317 | 9,180 | 9,574 | 9,803 | 9,447 | 8,843 | 8,759 | 8,425 | 8,522 |
| 2022 | 8,036 | 7,733 | 8,156 | 8,010 | 9,210 | 9,109 | 9,669 | 9,695 | 8,884 | 8,819 | 8,327 | 8,162 |
| 2023 | 7,922 | 7,459 | 8,039 | 7,548 | 9,098 | 9,104 | 9,094 | 9,313 | 8,332 | 8,871 | 8,382 | 8,105 |
| 2024 | 7,885 | |||||||||||
| - = No Data Reported; -- = Not Applicable; NA = Not Available; W = Withheld to avoid disclosure of individual company data. |
| Release Date: 3/29/2024 |
| Next Release Date: 4/30/2024 |