|
Download Data (XLS File) |
|
||||||||
|
||||||||
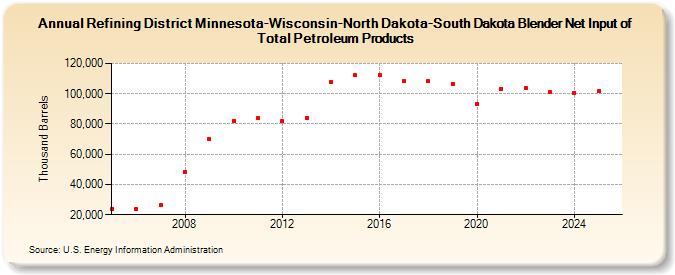
| Refining District Minnesota-Wisconsin-North Dakota-South Dakota Blender Net Input of Total Petroleum Products (Thousand Barrels) | ||||||||
| Decade | Year-0 | Year-1 | Year-2 | Year-3 | Year-4 | Year-5 | Year-6 | Year-7 | Year-8 | Year-9 |
|---|---|---|---|---|---|---|---|---|---|---|
| 2000's | 24,041 | 23,618 | 26,377 | 48,323 | 69,908 | |||||
| 2010's | 82,226 | 83,839 | 81,959 | 83,944 | 107,707 | 112,213 | 112,588 | 108,556 | 108,180 | 106,645 |
| 2020's | 92,941 | 103,452 | 103,810 | 101,280 |
| - = No Data Reported; -- = Not Applicable; NA = Not Available; W = Withheld to avoid disclosure of individual company data. |
| Release Date: 8/30/2024 |
| Next Release Date: 8/29/2025 |