|
Download Data (XLS File) |
|
||||||||
|
||||||||
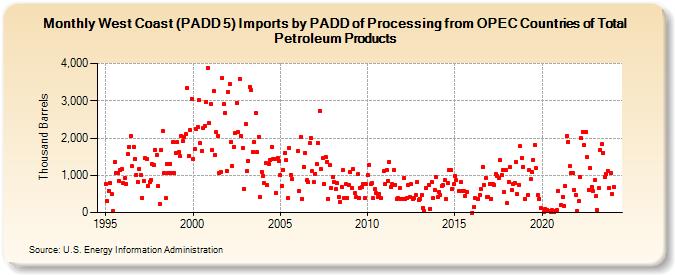
| West Coast (PADD 5) Imports by PADD of Processing from OPEC Countries of Total Petroleum Products (Thousand Barrels) | ||||||||
| Year | Jan | Feb | Mar | Apr | May | Jun | Jul | Aug | Sep | Oct | Nov | Dec |
|---|---|---|---|---|---|---|---|---|---|---|---|---|
| 1995 | 772 | 306 | 590 | 798 | 489 | 31 | 1,351 | 1,055 | 1,052 | 858 | 1,134 | 1,161 |
| 1996 | 799 | 925 | 768 | 1,566 | 1,768 | 2,048 | 1,237 | 1,772 | 1,446 | 1,020 | 819 | 1,169 |
| 1997 | 1,011 | 398 | 849 | 1,453 | 1,443 | 714 | 822 | 868 | 1,290 | 1,283 | 1,686 | 1,557 |
| 1998 | 717 | 229 | 1,681 | 2,200 | 1,066 | 382 | 1,312 | 1,067 | 1,315 | 1,069 | 1,882 | 1,061 |
| 1999 | 1,605 | 1,880 | 1,628 | 1,505 | 2,064 | 1,919 | 2,029 | 2,108 | 3,342 | 1,511 | 2,205 | 3,053 |
| 2000 | 1,439 | 1,700 | 2,245 | 2,298 | 3,014 | 1,854 | 1,657 | 2,261 | 2,331 | 2,968 | 3,873 | 2,392 |
| 2001 | 2,902 | 1,667 | 3,255 | 1,538 | 2,154 | 2,064 | 1,061 | 1,088 | 3,612 | 2,909 | 2,665 | 1,121 |
| 2002 | 3,226 | 3,438 | 1,904 | 1,248 | 1,771 | 2,130 | 2,941 | 2,161 | 3,592 | 2,049 | 1,743 | 645 |
| 2003 | 2,364 | 1,102 | 1,390 | 3,372 | 3,277 | 1,632 | 1,903 | 2,666 | 1,618 | 2,040 | 419 | 1,098 |
| 2004 | 991 | 784 | 1,322 | 737 | 1,309 | 1,398 | 1,761 | 1,430 | 1,449 | 537 | 1,461 | 1,372 |
| 2005 | 995 | 715 | 1,149 | 1,602 | 1,415 | 381 | 1,728 | 1,010 | 893 | |||
| 2006 | 1,649 | 570 | 2,034 | 377 | 1,232 | 1,605 | 861 | 810 | 1,873 | 1,995 | 1,109 | 811 |
| 2007 | 1,044 | 1,313 | 1,862 | 2,730 | 1,162 | 1,466 | 767 | 1,496 | 1,370 | 371 | 1,270 | 661 |
| 2008 | 952 | 810 | 622 | 792 | 429 | 288 | 697 | 1,130 | 382 | 755 | 395 | 732 |
| 2009 | 1,082 | 662 | 1,164 | 512 | 421 | 1,024 | 383 | 666 | 679 | 764 | 395 | 762 |
| 2010 | 999 | 1,279 | 756 | 784 | 379 | 621 | 513 | 425 | 502 | 378 | 1,108 | |
| 2011 | 758 | 1,144 | 859 | 1,367 | 674 | 756 | 1,147 | 746 | 365 | 380 | 655 | 362 |
| 2012 | 362 | 937 | 365 | 379 | 730 | 408 | 758 | 374 | 379 | 460 | 825 | 340 |
| 2013 | 375 | 473 | 131 | 33 | 656 | 744 | 106 | 825 | 382 | 617 | 947 | |
| 2014 | 414 | 553 | 483 | 725 | 729 | 863 | 361 | 803 | 1,141 | 1,146 | 641 | 756 |
| 2015 | 986 | 864 | 570 | 818 | 573 | 570 | 449 | 558 | ||||
| 2016 | 1 | 143 | 382 | 373 | 466 | 632 | 1,225 | 747 | 926 | 429 | 417 | |
| 2017 | 773 | 373 | 768 | 748 | 1,038 | 988 | 932 | 1,398 | 1,014 | 1,137 | 547 | 1,146 |
| 2018 | 251 | 824 | 1,218 | 603 | 767 | 801 | 1,358 | 491 | 751 | 1,781 | 1,472 | 1,234 |
| 2019 | 368 | 466 | 1,130 | 888 | 1,090 | 1,422 | 1,813 | 1,184 | 469 | 370 | 109 | |
| 2020 | 10 | 100 | 80 | 29 | 47 | 17 | 56 | 26 | 29 | 56 | 581 | |
| 2021 | 216 | 427 | 189 | 712 | 2,056 | 1,904 | 1,242 | 1,058 | 1,068 | 614 | 476 | |
| 2022 | 43 | 300 | 963 | 1,992 | 2,169 | 1,810 | 2,157 | 1,479 | 612 | 1,197 | 696 | 578 |
| 2023 | 864 | 433 | 61 | 659 | 1,689 | 1,841 | 1,607 | 945 | 1,027 | 1,127 | 656 | 1,058 |
| 2024 | 500 | |||||||||||
| - = No Data Reported; -- = Not Applicable; NA = Not Available; W = Withheld to avoid disclosure of individual company data. |
| Release Date: 3/29/2024 |
| Next Release Date: 4/30/2024 |