|
Download Data (XLS File) |
|
||||||||
|
||||||||
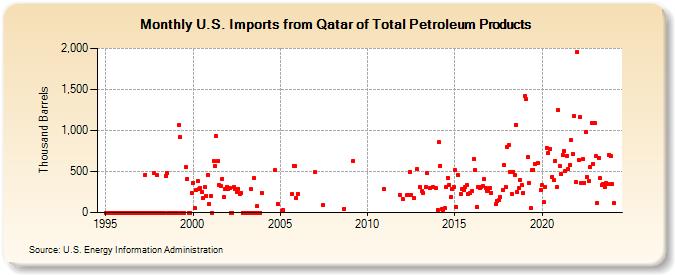
| U.S. Imports from Qatar of Total Petroleum Products (Thousand Barrels) | ||||||||
| Year | Jan | Feb | Mar | Apr | May | Jun | Jul | Aug | Sep | Oct | Nov | Dec |
|---|---|---|---|---|---|---|---|---|---|---|---|---|
| 1995 | 0 | 0 | 0 | 0 | 0 | 0 | 0 | 0 | 0 | 0 | 0 | 0 |
| 1996 | 0 | 0 | 0 | 0 | 0 | 0 | 0 | 0 | 0 | 0 | 0 | 0 |
| 1997 | 0 | 0 | 0 | 461 | 0 | 0 | 0 | 0 | 0 | 481 | 0 | 460 |
| 1998 | 0 | 0 | 0 | 0 | 0 | 448 | 479 | 0 | 0 | 0 | 0 | 0 |
| 1999 | 0 | 0 | 1,062 | 919 | 0 | 0 | 0 | 551 | 414 | 0 | 0 | 241 |
| 2000 | 365 | 56 | 274 | 382 | 286 | 297 | 247 | 175 | 313 | 207 | 458 | 102 |
| 2001 | 202 | 0 | 631 | 572 | 932 | 633 | 334 | 320 | 413 | 188 | 288 | 312 |
| 2002 | 285 | 296 | 0 | 0 | 313 | 288 | 254 | 293 | 226 | 243 | 0 | 0 |
| 2003 | 0 | 0 | 0 | 0 | 283 | 0 | 423 | 0 | 75 | 0 | 0 | 243 |
| 2004 | 514 | 106 | ||||||||||
| 2005 | 25 | 31 | 226 | 572 | 567 | 173 | ||||||
| 2006 | 232 | |||||||||||
| 2007 | 491 | 90 | ||||||||||
| 2008 | 49 | |||||||||||
| 2009 | 630 | |||||||||||
| 2010 | 291 | |||||||||||
| 2011 | 215 | |||||||||||
| 2012 | 166 | 211 | 209 | 497 | 211 | 179 | 528 | |||||
| 2013 | 310 | 258 | 237 | 309 | 479 | 305 | 306 | 305 | ||||
| 2014 | 35 | 855 | 573 | 40 | 31 | 52 | 307 | 425 | 336 | 185 | 292 | 306 |
| 2015 | 517 | 65 | 461 | 230 | 285 | 273 | 308 | 333 | 231 | 233 | ||
| 2016 | 261 | 653 | 518 | 69 | 317 | 301 | 314 | 323 | 404 | 300 | 266 | 269 |
| 2017 | 298 | 243 | 99 | 138 | 147 | 190 | 275 | 575 | 310 | |||
| 2018 | 799 | 821 | 497 | 229 | 498 | 459 | 1,072 | 249 | 301 | 398 | 334 | 242 |
| 2019 | 1,417 | 1,378 | 674 | 364 | 52 | 520 | 524 | 594 | 606 | 271 | ||
| 2020 | 330 | 124 | 317 | 790 | 722 | 769 | 436 | 393 | 634 | 317 | 1,247 | |
| 2021 | 573 | 466 | 707 | 745 | 504 | 691 | 526 | 577 | 881 | 715 | 1,175 | 369 |
| 2022 | 1,959 | 641 | 1,162 | 358 | 655 | 365 | 983 | 431 | 388 | 556 | 1,091 | 593 |
| 2023 | 1,087 | 685 | 118 | 670 | 416 | 340 | 347 | 312 | 365 | 344 | 707 | 683 |
| 2024 | 346 | |||||||||||
| - = No Data Reported; -- = Not Applicable; NA = Not Available; W = Withheld to avoid disclosure of individual company data. |
| Release Date: 3/29/2024 |
| Next Release Date: 4/30/2024 |
Referring Pages: