|
Download Data (XLS File) |
|
||||||||
|
||||||||
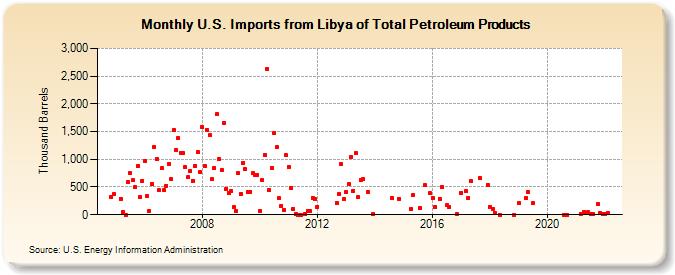
| U.S. Imports from Libya of Total Petroleum Products (Thousand Barrels) | ||||||||
| Year | Jan | Feb | Mar | Apr | May | Jun | Jul | Aug | Sep | Oct | Nov | Dec |
|---|---|---|---|---|---|---|---|---|---|---|---|---|
| 2004 | 312 | 374 | ||||||||||
| 2005 | 292 | 45 | 1 | 589 | 746 | 621 | 494 | 877 | 312 | 609 | ||
| 2006 | 965 | 331 | 68 | 553 | 1,225 | 1,002 | 439 | 837 | 440 | 525 | 918 | 644 |
| 2007 | 1,529 | 1,166 | 1,381 | 1,114 | 1,113 | 855 | 675 | 784 | 613 | 884 | 1,129 | 764 |
| 2008 | 1,583 | 872 | 1,531 | 1,435 | 639 | 844 | 1,811 | 996 | 805 | 1,657 | 470 | 400 |
| 2009 | 424 | 134 | 61 | 747 | 374 | 936 | 816 | 407 | 417 | 747 | 721 | 725 |
| 2010 | 68 | 629 | 1,080 | 2,629 | 443 | 844 | 1,470 | 1,218 | 293 | 158 | 86 | 1,069 |
| 2011 | 869 | 489 | 107 | 18 | 2 | 1 | 20 | 59 | 59 | 303 | 287 | |
| 2012 | 146 | 212 | 376 | 908 | 281 | |||||||
| 2013 | 406 | 549 | 1,049 | 436 | 1,110 | 312 | 622 | 639 | 410 | 10 | ||
| 2014 | 308 | 291 | ||||||||||
| 2015 | 100 | 357 | 117 | 528 | 385 | |||||||
| 2016 | 310 | 143 | 292 | 508 | 168 | 148 | 8 | |||||
| 2017 | 395 | 423 | 302 | 600 | 659 | 544 | ||||||
| 2018 | 147 | 111 | 38 | 2 | 2 | |||||||
| 2019 | 205 | 298 | 413 | 207 | ||||||||
| 2020 | 2 | 1 | ||||||||||
| 2021 | 21 | 48 | 27 | 41 | 21 | 18 | 191 | 27 | 18 | |||
| 2022 | 16 | 30 | ||||||||||
| - = No Data Reported; -- = Not Applicable; NA = Not Available; W = Withheld to avoid disclosure of individual company data. |
| Release Date: 3/29/2024 |
| Next Release Date: 4/30/2024 |
Referring Pages: