|
Download Data (XLS File) |
|
||||||||
|
||||||||
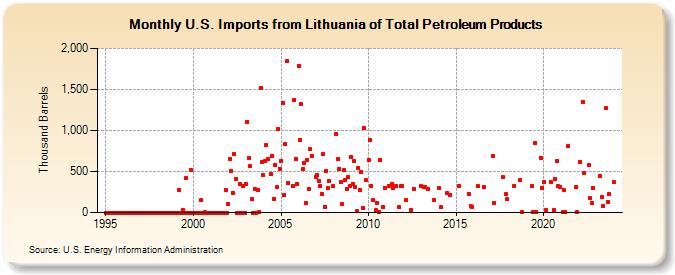
| U.S. Imports from Lithuania of Total Petroleum Products (Thousand Barrels) | ||||||||
| Year | Jan | Feb | Mar | Apr | May | Jun | Jul | Aug | Sep | Oct | Nov | Dec |
|---|---|---|---|---|---|---|---|---|---|---|---|---|
| 1995 | 0 | 0 | 0 | 0 | 0 | 0 | 0 | 0 | 0 | 0 | 0 | 0 |
| 1996 | 0 | 0 | 0 | 0 | 0 | 0 | 0 | 0 | 0 | 0 | 0 | 0 |
| 1997 | 0 | 0 | 0 | 0 | 0 | 0 | 0 | 0 | 0 | 0 | 0 | 0 |
| 1998 | 0 | 0 | 0 | 0 | 0 | 0 | 0 | 0 | 0 | 0 | 0 | 0 |
| 1999 | 0 | 0 | 272 | 0 | 0 | 30 | 0 | 420 | 0 | 0 | 519 | 0 |
| 2000 | 0 | 0 | 0 | 0 | 0 | 148 | 0 | 0 | 2 | 0 | 0 | 0 |
| 2001 | 0 | 0 | 0 | 0 | 0 | 0 | 0 | 0 | 0 | 0 | 278 | 0 |
| 2002 | 106 | 654 | 511 | 240 | 710 | 409 | 0 | 0 | 352 | 0 | 323 | 0 |
| 2003 | 349 | 1,106 | 667 | 563 | 160 | 0 | 293 | 0 | 275 | 7 | 1,519 | 622 |
| 2004 | 459 | 623 | 820 | 648 | 475 | 695 | 166 | 578 | 311 | 1,018 | 534 | |
| 2005 | 634 | 1,337 | 215 | 834 | 1,842 | 365 | 325 | 1,377 | 648 | 346 | ||
| 2006 | 1,789 | 884 | 1,321 | 526 | 603 | 121 | 641 | 292 | 771 | 693 | ||
| 2007 | 439 | 452 | 388 | 328 | 231 | 708 | 68 | 505 | 300 | 381 | ||
| 2008 | 328 | 955 | 658 | 530 | 371 | 100 | 516 | 396 | 282 | 437 | 329 | |
| 2009 | 674 | 352 | 623 | 314 | 15 | 540 | 273 | 489 | 57 | 1,030 | 391 | |
| 2010 | 646 | 878 | 321 | 149 | 27 | 121 | 1 | 642 | 70 | 305 | ||
| 2011 | 325 | 342 | 300 | 324 | 64 | 323 | 327 | |||||
| 2012 | 157 | 32 | 288 | |||||||||
| 2013 | 319 | 311 | 313 | 284 | 153 | |||||||
| 2014 | 302 | 67 | 237 | 208 | ||||||||
| 2015 | 329 | 230 | 79 | 65 | ||||||||
| 2016 | 320 | 314 | ||||||||||
| 2017 | 691 | 119 | 431 | 222 | 161 | |||||||
| 2018 | 323 | 398 | 6 | |||||||||
| 2019 | 325 | 12 | 845 | 7 | 669 | 302 | ||||||
| 2020 | 374 | 27 | 376 | 34 | 413 | 629 | 320 | 317 | ||||
| 2021 | 2 | 280 | 5 | 813 | 308 | 2 | ||||||
| 2022 | 616 | 1,348 | 481 | 580 | 179 | 113 | 298 | |||||
| 2023 | 441 | 193 | 77 | 1,273 | 317 | 225 | ||||||
| 2024 | 371 | 4 | 638 | |||||||||
| - = No Data Reported; -- = Not Applicable; NA = Not Available; W = Withheld to avoid disclosure of individual company data. |
| Release Date: 8/30/2024 |
| Next Release Date: 9/30/2024 |