|
Download Data (XLS File) |
|
||||||||
|
||||||||
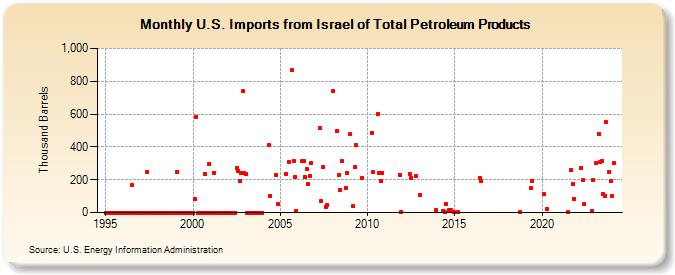
| U.S. Imports from Israel of Total Petroleum Products (Thousand Barrels) | ||||||||
| Year | Jan | Feb | Mar | Apr | May | Jun | Jul | Aug | Sep | Oct | Nov | Dec |
|---|---|---|---|---|---|---|---|---|---|---|---|---|
| 1995 | 0 | 0 | 0 | 0 | 0 | 0 | 0 | 0 | 0 | 0 | 0 | 0 |
| 1996 | 0 | 0 | 0 | 0 | 0 | 0 | 169 | 0 | 0 | 0 | 0 | 0 |
| 1997 | 0 | 0 | 0 | 0 | 248 | 0 | 0 | 0 | 0 | 0 | 0 | 0 |
| 1998 | 0 | 0 | 0 | 0 | 0 | 0 | 0 | 0 | 0 | 0 | 0 | 0 |
| 1999 | 0 | 250 | 0 | 0 | 0 | 0 | 0 | 0 | 0 | 0 | 0 | 0 |
| 2000 | 0 | 84 | 585 | 0 | 0 | 0 | 0 | 0 | 237 | 0 | 0 | 293 |
| 2001 | 0 | 0 | 241 | 0 | 0 | 0 | 0 | 0 | 0 | 0 | 0 | 0 |
| 2002 | 0 | 0 | 0 | 0 | 0 | 0 | 274 | 255 | 195 | 240 | 738 | 240 |
| 2003 | 233 | 0 | 0 | 0 | 0 | 0 | 0 | 0 | 0 | 0 | 0 | 0 |
| 2004 | 413 | 103 | 229 | 50 | ||||||||
| 2005 | 237 | 308 | 866 | 315 | 218 | 12 | ||||||
| 2006 | 316 | 315 | 216 | 266 | 176 | 222 | 301 | |||||
| 2007 | 514 | 70 | 278 | 36 | 46 | |||||||
| 2008 | 739 | 499 | 230 | 136 | 316 | 152 | 241 | |||||
| 2009 | 478 | 37 | 278 | 412 | 213 | |||||||
| 2010 | 486 | 245 | 601 | 241 | 190 | 244 | ||||||
| 2011 | 229 | 2 | ||||||||||
| 2012 | 234 | 212 | 222 | |||||||||
| 2013 | 109 | 15 | ||||||||||
| 2014 | 12 | 1 | 52 | 15 | 14 | 6 | ||||||
| 2015 | 1 | |||||||||||
| 2016 | 213 | 191 | ||||||||||
| 2018 | 3 | |||||||||||
| 2019 | 150 | 195 | ||||||||||
| 2020 | 111 | 19 | ||||||||||
| 2021 | 2 | 262 | 177 | 83 | ||||||||
| 2022 | 272 | 196 | 50 | 7 | 198 | |||||||
| 2023 | 300 | 481 | 311 | 317 | 112 | 103 | 551 | 246 | 195 | |||
| 2024 | 99 | |||||||||||
| - = No Data Reported; -- = Not Applicable; NA = Not Available; W = Withheld to avoid disclosure of individual company data. |
| Release Date: 3/29/2024 |
| Next Release Date: 4/30/2024 |
Referring Pages: