|
Download Data (XLS File) |
|
||||||||
|
||||||||
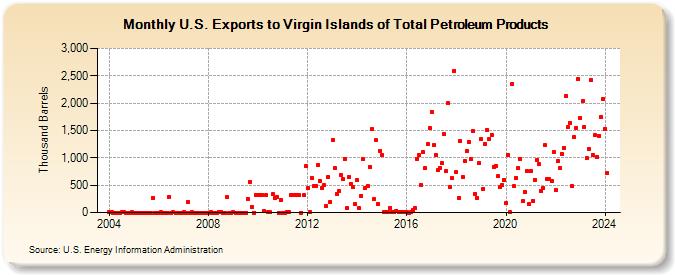
| U.S. Exports to Virgin Islands of Total Petroleum Products (Thousand Barrels) | ||||||||
| Year | Jan | Feb | Mar | Apr | May | Jun | Jul | Aug | Sep | Oct | Nov | Dec |
|---|---|---|---|---|---|---|---|---|---|---|---|---|
| 2004 | 5 | 4 | 0 | 0 | 0 | 1 | 4 | 2 | 1 | 0 | 0 | 3 |
| 2005 | 0 | 0 | 0 | 1 | 0 | 0 | 0 | 1 | 1 | 271 | 1 | 1 |
| 2006 | 1 | 2 | 1 | 1 | 1 | 280 | 1 | 4 | 1 | 1 | 0 | 1 |
| 2007 | 2 | 1 | 201 | 0 | 3 | 1 | 1 | 1 | 1 | 1 | 0 | 1 |
| 2008 | 0 | 2 | 1 | 1 | 1 | 2 | 8 | 1 | 1 | 276 | 1 | 1 |
| 2009 | 2 | 1 | 1 | 1 | 1 | 1 | 1 | 251 | 567 | 108 | 0 | 326 |
| 2010 | 321 | 318 | 324 | 23 | 314 | 3 | 3 | 331 | 270 | 280 | 1 | 226 |
| 2011 | 1 | 1 | 10 | 2 | 327 | 324 | 322 | 320 | 318 | 1 | 315 | 844 |
| 2012 | 442 | 2 | 634 | 481 | 484 | 866 | 579 | 456 | 495 | 117 | 647 | 194 |
| 2013 | 1,330 | 810 | 340 | 386 | 686 | 611 | 977 | 77 | 651 | 526 | 461 | 154 |
| 2014 | 586 | 78 | 311 | 970 | 450 | 479 | 836 | 1,529 | 242 | 1,319 | 159 | 1,130 |
| 2015 | 1,049 | 2 | 3 | 4 | 88 | 2 | 2 | 37 | 2 | 3 | 5 | 4 |
| 2016 | 3 | 1 | 2 | 49 | 81 | 984 | 1,043 | 502 | 1,099 | 806 | 1,248 | 1,544 |
| 2017 | 1,846 | 1,233 | 1,052 | 769 | 813 | 900 | 1,427 | 755 | 1,996 | 464 | 624 | 2,593 |
| 2018 | 733 | 266 | 1,305 | 650 | 938 | 1,117 | 1,295 | 983 | 1,486 | 345 | 267 | 903 |
| 2019 | 1,337 | 439 | 1,255 | 1,513 | 1,345 | 1,418 | 836 | 858 | 662 | 459 | 495 | 604 |
| 2020 | 167 | 1,052 | 2 | 2,352 | 479 | 637 | 815 | 975 | 210 | 376 | 754 | 148 |
| 2021 | 761 | 219 | 600 | 957 | 879 | 401 | 452 | 1,226 | 611 | 605 | 584 | 1,110 |
| 2022 | 413 | 938 | 812 | 1,077 | 1,187 | 2,130 | 1,560 | 1,642 | 483 | 1,378 | 1,547 | 2,437 |
| 2023 | 1,733 | 2,030 | 1,559 | 988 | 1,163 | 2,424 | 1,057 | 1,410 | 1,009 | 1,405 | 1,745 | 2,075 |
| 2024 | 1,534 | |||||||||||
| - = No Data Reported; -- = Not Applicable; NA = Not Available; W = Withheld to avoid disclosure of individual company data. |
| Release Date: 3/29/2024 |
| Next Release Date: 4/30/2024 |