|
Download Data (XLS File) |
|
||||||||
|
||||||||
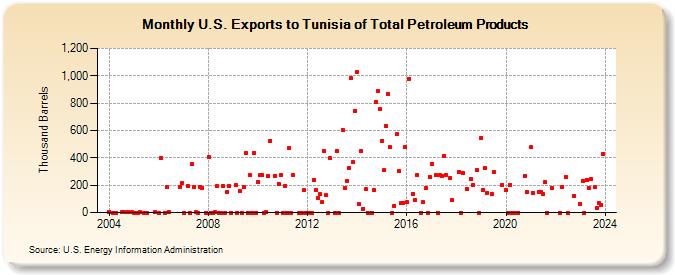
| U.S. Exports to Tunisia of Total Petroleum Products (Thousand Barrels) | ||||||||
| Year | Jan | Feb | Mar | Apr | May | Jun | Jul | Aug | Sep | Oct | Nov | Dec |
|---|---|---|---|---|---|---|---|---|---|---|---|---|
| 2004 | 1 | 0 | 0 | 1 | 2 | 1 | 3 | |||||
| 2005 | 0 | 0 | 1 | 0 | 0 | 1 | ||||||
| 2006 | 0 | 401 | 0 | 188 | 1 | 187 | 214 | |||||
| 2007 | 0 | 194 | 0 | 354 | 189 | 1 | 0 | 187 | 182 | 0 | ||
| 2008 | 406 | 0 | 0 | 2 | 194 | 0 | 0 | 194 | 0 | 149 | 194 | 0 |
| 2009 | 199 | 0 | 159 | 0 | 190 | 434 | 0 | 271 | 0 | 438 | 0 | |
| 2010 | 226 | 276 | 272 | 0 | 1 | 267 | 526 | 270 | 0 | 212 | 273 | |
| 2011 | 0 | 197 | 0 | 471 | 0 | 272 | 0 | 0 | 163 | 0 | ||
| 2012 | 0 | 0 | 0 | 237 | 165 | 108 | 136 | 74 | 450 | 125 | 0 | 396 |
| 2013 | 0 | 452 | 0 | 603 | 180 | 232 | 323 | 981 | 366 | 746 | ||
| 2014 | 1,028 | 61 | 448 | 29 | 170 | 0 | 0 | 165 | 810 | 890 | 756 | |
| 2015 | 524 | 310 | 632 | 865 | 479 | 0 | 49 | 572 | 303 | 67 | 73 | 482 |
| 2016 | 74 | 975 | 139 | 95 | 276 | 0 | 75 | 176 | 0 | 263 | ||
| 2017 | 358 | 274 | 0 | 275 | 266 | 414 | 275 | 252 | 89 | |||
| 2018 | 294 | 0 | 286 | 171 | 248 | 204 | 308 | 0 | ||||
| 2019 | 548 | 165 | 323 | 145 | 137 | 299 | 204 | |||||
| 2020 | 163 | 0 | 205 | 0 | 0 | 0 | 270 | 151 | ||||
| 2021 | 477 | 146 | 153 | 151 | 135 | 220 | 0 | 176 | ||||
| 2022 | 0 | 188 | 261 | 0 | 122 | |||||||
| 2023 | 65 | 231 | 0 | 253 | 178 | 242 | 188 | 33 | 68 | 56 | 429 | |
| 2024 | 0 | 0 | 233 | 0 | ||||||||
| - = No Data Reported; -- = Not Applicable; NA = Not Available; W = Withheld to avoid disclosure of individual company data. |
| Release Date: 8/30/2024 |
| Next Release Date: 9/30/2024 |