|
Download Data (XLS File) |
|
||||||||
|
||||||||
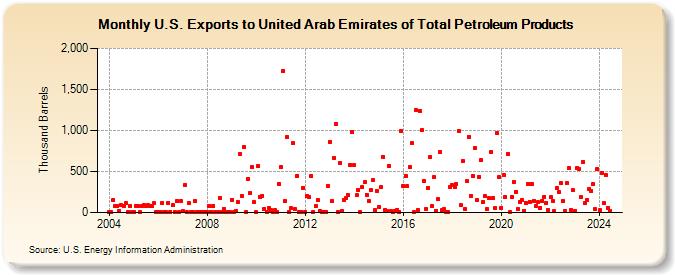
| U.S. Exports to United Arab Emirates of Total Petroleum Products (Thousand Barrels) | ||||||||
| Year | Jan | Feb | Mar | Apr | May | Jun | Jul | Aug | Sep | Oct | Nov | Dec |
|---|---|---|---|---|---|---|---|---|---|---|---|---|
| 2004 | 2 | 2 | 156 | 79 | 81 | 18 | 92 | 82 | 116 | 5 | 77 | 8 |
| 2005 | 11 | 81 | 85 | 3 | 77 | 87 | 79 | 89 | 83 | 78 | 112 | 3 |
| 2006 | 2 | 2 | 115 | 9 | 3 | 120 | 9 | 91 | 2 | 138 | 3 | 141 |
| 2007 | 13 | 337 | 2 | 117 | 4 | 1 | 137 | 8 | 4 | 2 | 4 | 2 |
| 2008 | 8 | 83 | 8 | 85 | 2 | 4 | 178 | 8 | 47 | 4 | 7 | 6 |
| 2009 | 158 | 2 | 20 | 131 | 716 | 205 | 801 | 8 | 409 | 239 | 551 | 123 |
| 2010 | 2 | 567 | 193 | 207 | 45 | 4 | 56 | 30 | 6 | 28 | 4 | 351 |
| 2011 | 552 | 1,723 | 140 | 918 | 7 | 50 | 847 | 38 | 450 | 6 | 5 | 305 |
| 2012 | 7 | 201 | 189 | 447 | 11 | 79 | 158 | 20 | 5 | 9 | 7 | 328 |
| 2013 | 864 | 140 | 668 | 1,081 | 7 | 607 | 21 | 155 | 175 | 212 | 581 | 981 |
| 2014 | 576 | 208 | 277 | 6 | 309 | 367 | 220 | 143 | 270 | 392 | 27 | 268 |
| 2015 | 67 | 306 | 681 | 30 | 21 | 565 | 25 | 5 | 25 | 33 | 7 | 996 |
| 2016 | 323 | 444 | 320 | 554 | 843 | 4 | 1,251 | 32 | 1,239 | 1,005 | 390 | 45 |
| 2017 | 302 | 674 | 80 | 433 | 23 | 162 | 735 | 31 | 45 | 8 | 7 | 306 |
| 2018 | 335 | 317 | 345 | 995 | 89 | 626 | 46 | 380 | 924 | 206 | 446 | 792 |
| 2019 | 149 | 437 | 636 | 132 | 197 | 44 | 176 | 738 | 177 | 50 | 964 | 432 |
| 2020 | 59 | 462 | 190 | 718 | 9 | 192 | 378 | 255 | 40 | 134 | 155 | 25 |
| 2021 | 120 | 345 | 134 | 347 | 146 | 74 | 124 | 61 | 145 | 195 | 121 | 34 |
| 2022 | 185 | 144 | 13 | 303 | 247 | 362 | 141 | 20 | 361 | 540 | 35 | 274 |
| 2023 | 25 | 519 | 552 | 165 | 622 | 121 | 158 | 287 | 257 | 358 | 20 | 528 |
| 2024 | 28 | |||||||||||
| - = No Data Reported; -- = Not Applicable; NA = Not Available; W = Withheld to avoid disclosure of individual company data. |
| Release Date: 3/29/2024 |
| Next Release Date: 4/30/2024 |