|
Download Data (XLS File) |
|
||||||||
|
||||||||
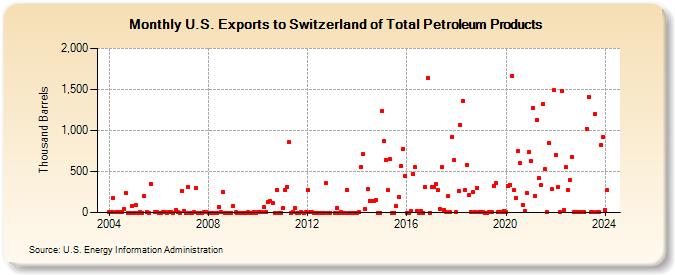
| U.S. Exports to Switzerland of Total Petroleum Products (Thousand Barrels) | ||||||||
| Year | Jan | Feb | Mar | Apr | May | Jun | Jul | Aug | Sep | Oct | Nov | Dec |
|---|---|---|---|---|---|---|---|---|---|---|---|---|
| 2004 | 1 | 1 | 178 | 1 | 10 | 1 | 2 | 41 | 238 | 0 | 0 | 83 |
| 2005 | 0 | 93 | 0 | 1 | 0 | 197 | 1 | 0 | 353 | 1 | 2 | |
| 2006 | 0 | 0 | 1 | 1 | 0 | 3 | 1 | 0 | 28 | 1 | 0 | 267 |
| 2007 | 15 | 0 | 316 | 0 | 0 | 3 | 297 | 0 | 0 | 0 | 1 | 1 |
| 2008 | 0 | 0 | 0 | 0 | 0 | 69 | 1 | 248 | 0 | 0 | 0 | 0 |
| 2009 | 83 | 1 | 0 | 0 | 0 | 0 | 0 | 1 | 0 | 0 | 10 | 0 |
| 2010 | 1 | 1 | 1 | 67 | 1 | 133 | 137 | 122 | 0 | 276 | 0 | 0 |
| 2011 | 53 | 273 | 317 | 854 | 0 | 1 | 56 | 0 | 0 | 1 | 0 | 1 |
| 2012 | 275 | 1 | 1 | 0 | 0 | 0 | 0 | 0 | 0 | 355 | 0 | 0 |
| 2013 | 0 | 54 | 0 | 1 | 0 | 0 | 280 | 0 | 0 | 0 | 0 | |
| 2014 | 0 | 1 | 556 | 709 | 38 | 283 | 141 | 136 | 135 | 154 | 0 | 0 |
| 2015 | 1,237 | 867 | 638 | 269 | 652 | 0 | 0 | 82 | 184 | 565 | 769 | 451 |
| 2016 | 0 | 0 | 20 | 471 | 550 | 20 | 0 | 21 | 0 | 309 | 1,643 | 0 |
| 2017 | 315 | 313 | 345 | 272 | 41 | 555 | 30 | 4 | 197 | 3 | 926 | 639 |
| 2018 | 5 | 261 | 1,071 | 1,365 | 276 | 580 | 215 | 4 | 255 | 4 | 303 | 4 |
| 2019 | 7 | 3 | 0 | 0 | 1 | 2 | 321 | 355 | 1 | 1 | 2 | 20 |
| 2020 | 1 | 318 | 340 | 1,669 | 272 | 179 | 746 | 598 | 97 | 24 | 239 | 738 |
| 2021 | 632 | 1,277 | 205 | 1,131 | 422 | 330 | 1,326 | 526 | 9 | 850 | 291 | 1,489 |
| 2022 | 705 | 310 | 2 | 1,486 | 30 | 550 | 269 | 391 | 680 | 2 | 4 | 3 |
| 2023 | 2 | 3 | 1 | 1,022 | 1,408 | 2 | 3 | 1,197 | 2 | 2 | 823 | 917 |
| 2024 | 32 | |||||||||||
| - = No Data Reported; -- = Not Applicable; NA = Not Available; W = Withheld to avoid disclosure of individual company data. |
| Release Date: 3/29/2024 |
| Next Release Date: 4/30/2024 |