|
Download Data (XLS File) |
|
||||||||
|
||||||||
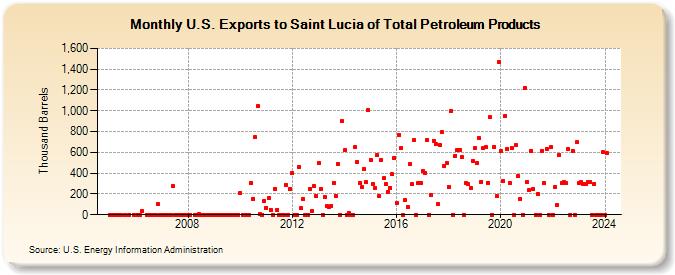
| U.S. Exports to Saint Lucia of Total Petroleum Products (Thousand Barrels) | ||||||||
| Year | Jan | Feb | Mar | Apr | May | Jun | Jul | Aug | Sep | Oct | Nov | Dec |
|---|---|---|---|---|---|---|---|---|---|---|---|---|
| 2005 | 0 | 0 | 0 | 0 | 0 | 0 | 0 | 0 | 0 | |||
| 2006 | 0 | 0 | 0 | 35 | 0 | 0 | 0 | 0 | 0 | 100 | 0 | |
| 2007 | 0 | 0 | 0 | 0 | 1 | 273 | 1 | 0 | 0 | 0 | 0 | 2 |
| 2008 | 0 | 0 | 0 | 0 | 5 | 0 | 0 | 0 | 0 | 1 | 0 | |
| 2009 | 0 | 0 | 1 | 0 | 1 | 0 | 0 | 1 | 2 | 0 | 0 | 0 |
| 2010 | 210 | 0 | 1 | 1 | 0 | 304 | 155 | 745 | 1,044 | 4 | 0 | 130 |
| 2011 | 67 | 159 | 49 | 0 | 250 | 50 | 0 | 0 | 1 | 290 | 1 | 250 |
| 2012 | 401 | 1 | 0 | 461 | 60 | 149 | 0 | 1 | 249 | 33 | 275 | 180 |
| 2013 | 494 | 244 | 0 | 170 | 83 | 78 | 86 | 309 | 179 | 492 | 0 | 900 |
| 2014 | 620 | 0 | 19 | 0 | 0 | 652 | 508 | 303 | 264 | 438 | 312 | 1,006 |
| 2015 | 529 | 299 | 257 | 571 | 183 | 528 | 349 | 295 | 221 | 261 | 388 | 548 |
| 2016 | 109 | 768 | 641 | 0 | 138 | 75 | 486 | 292 | 716 | 0 | 306 | 306 |
| 2017 | 418 | 406 | 718 | 0 | 190 | 712 | 676 | 100 | 670 | 792 | 471 | 493 |
| 2018 | 271 | 1,002 | 0 | 568 | 620 | 625 | 556 | 0 | 305 | 295 | 255 | 517 |
| 2019 | 637 | 493 | 736 | 318 | 639 | 649 | 309 | 937 | 0 | 655 | 177 | 1,467 |
| 2020 | 611 | 322 | 946 | 636 | 306 | 641 | 1 | 669 | 373 | 149 | 0 | 1,221 |
| 2021 | 316 | 236 | 616 | 246 | 1 | 201 | 0 | 614 | 302 | 631 | 1 | 647 |
| 2022 | 0 | 271 | 94 | 573 | 301 | 310 | 306 | 628 | 1 | 617 | 1 | 696 |
| 2023 | 302 | 316 | 298 | 297 | 314 | 316 | 1 | 300 | 1 | 0 | 1 | 600 |
| 2024 | 1 | |||||||||||
| - = No Data Reported; -- = Not Applicable; NA = Not Available; W = Withheld to avoid disclosure of individual company data. |
| Release Date: 3/29/2024 |
| Next Release Date: 4/30/2024 |