|
Download Data (XLS File) |
|
||||||||
|
||||||||
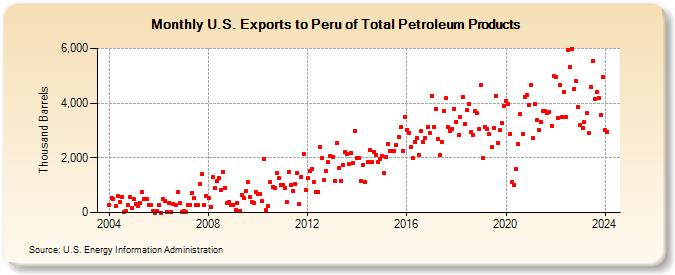
| U.S. Exports to Peru of Total Petroleum Products (Thousand Barrels) | ||||||||
| Year | Jan | Feb | Mar | Apr | May | Jun | Jul | Aug | Sep | Oct | Nov | Dec |
|---|---|---|---|---|---|---|---|---|---|---|---|---|
| 2004 | 269 | 525 | 479 | 251 | 587 | 393 | 562 | 24 | 61 | 270 | 565 | 160 |
| 2005 | 480 | 299 | 247 | 335 | 737 | 510 | 506 | 284 | 264 | 46 | 2 | 41 |
| 2006 | 290 | 2 | 482 | 430 | 21 | 353 | 18 | 304 | 279 | 734 | 364 | 23 |
| 2007 | 45 | 36 | 286 | 293 | 730 | 517 | 263 | 280 | 1,049 | 1,417 | 282 | 619 |
| 2008 | 522 | 196 | 1,286 | 893 | 1,162 | 1,254 | 813 | 1,478 | 905 | 332 | 391 | 268 |
| 2009 | 294 | 79 | 333 | 53 | 642 | 543 | 771 | 1,125 | 577 | 379 | 356 | 738 |
| 2010 | 692 | 696 | 421 | 1,953 | 79 | 239 | 1,109 | 934 | 892 | 1,449 | 1,269 | 1,014 |
| 2011 | 1,005 | 908 | 374 | 1,489 | 1,004 | 780 | 1,040 | 1,447 | 315 | 1,316 | 2,154 | 821 |
| 2012 | 1,261 | 1,534 | 1,606 | 1,125 | 753 | 746 | 2,407 | 2,000 | 1,199 | 1,536 | 1,846 | 2,073 |
| 2013 | 2,016 | 1,168 | 2,537 | 1,619 | 1,150 | 1,753 | 2,213 | 2,125 | 1,768 | 2,192 | 1,824 | 2,985 |
| 2014 | 1,994 | 1,988 | 1,159 | 1,754 | 1,106 | 1,834 | 2,301 | 1,857 | 2,216 | 2,121 | 1,831 | 1,960 |
| 2015 | 2,084 | 1,430 | 2,034 | 2,496 | 2,257 | 2,243 | 2,266 | 2,477 | 2,774 | 3,116 | 2,257 | 3,494 |
| 2016 | 3,028 | 2,917 | 2,408 | 1,983 | 2,590 | 2,735 | 2,115 | 2,973 | 2,578 | 2,725 | 3,116 | 2,920 |
| 2017 | 4,264 | 3,129 | 3,800 | 2,696 | 2,095 | 2,594 | 3,717 | 4,203 | 3,134 | 2,981 | 3,071 | 3,794 |
| 2018 | 3,328 | 2,848 | 3,488 | 4,229 | 3,222 | 3,733 | 3,972 | 2,938 | 2,829 | 3,694 | 3,624 | 3,049 |
| 2019 | 4,649 | 1,997 | 3,117 | 3,043 | 2,855 | 2,410 | 3,102 | 4,264 | 2,553 | 3,014 | 3,264 | 3,909 |
| 2020 | 4,090 | 3,965 | 2,854 | 1,115 | 1,009 | 1,583 | 2,492 | 3,613 | 2,853 | 4,230 | 4,283 | 3,915 |
| 2021 | 4,646 | 2,714 | 3,958 | 3,369 | 3,021 | 3,311 | 3,703 | 3,711 | 3,642 | 3,677 | 3,178 | 5,005 |
| 2022 | 4,939 | 3,440 | 4,656 | 3,482 | 4,414 | 3,491 | 5,951 | 5,335 | 5,986 | 4,524 | 4,790 | 3,850 |
| 2023 | 3,208 | 3,102 | 3,297 | 3,635 | 2,896 | 4,593 | 5,548 | 4,160 | 4,401 | 4,203 | 3,556 | 4,970 |
| 2024 | 3,006 | |||||||||||
| - = No Data Reported; -- = Not Applicable; NA = Not Available; W = Withheld to avoid disclosure of individual company data. |
| Release Date: 3/29/2024 |
| Next Release Date: 4/30/2024 |