|
Download Data (XLS File) |
|
||||||||
|
||||||||
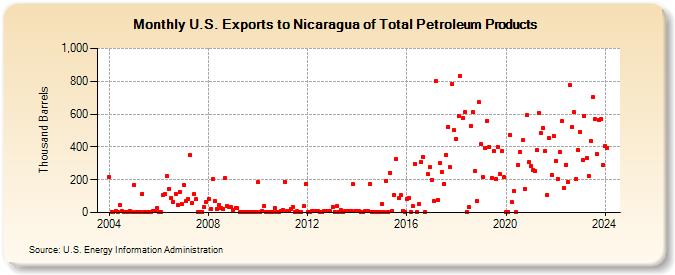
| U.S. Exports to Nicaragua of Total Petroleum Products (Thousand Barrels) | ||||||||
| Year | Jan | Feb | Mar | Apr | May | Jun | Jul | Aug | Sep | Oct | Nov | Dec |
|---|---|---|---|---|---|---|---|---|---|---|---|---|
| 2004 | 216 | 3 | 4 | 8 | 5 | 44 | 7 | 6 | 2 | 6 | 8 | 3 |
| 2005 | 169 | 1 | 5 | 4 | 116 | 3 | 2 | 4 | 5 | 8 | 7 | 25 |
| 2006 | 1 | 3 | 108 | 113 | 222 | 143 | 89 | 67 | 116 | 46 | 127 | 53 |
| 2007 | 169 | 68 | 81 | 350 | 58 | 112 | 80 | 5 | 3 | 5 | 33 | 65 |
| 2008 | 85 | 23 | 203 | 69 | 22 | 47 | 25 | 24 | 210 | 41 | 31 | 32 |
| 2009 | 17 | 30 | 25 | 3 | 4 | 5 | 4 | 4 | 1 | 4 | 5 | 4 |
| 2010 | 184 | 3 | 8 | 40 | 6 | 5 | 3 | 4 | 29 | 5 | 4 | 7 |
| 2011 | 18 | 188 | 7 | 8 | 23 | 36 | 4 | 7 | 5 | 3 | 37 | 174 |
| 2012 | 4 | 5 | 8 | 7 | 10 | 7 | 6 | 5 | 8 | 9 | 10 | 7 |
| 2013 | 35 | 5 | 37 | 6 | 14 | 6 | 7 | 7 | 8 | 9 | 172 | 7 |
| 2014 | 7 | 7 | 4 | 5 | 7 | 8 | 175 | 5 | 5 | 6 | 5 | 5 |
| 2015 | 55 | 4 | 195 | 6 | 243 | 9 | 107 | 326 | 86 | 106 | 7 | 5 |
| 2016 | 85 | 89 | 6 | 37 | 297 | 6 | 53 | 307 | 337 | 4 | 232 | 276 |
| 2017 | 200 | 71 | 801 | 79 | 300 | 248 | 174 | 353 | 523 | 275 | 784 | 500 |
| 2018 | 448 | 589 | 830 | 573 | 610 | 4 | 31 | 530 | 611 | 255 | 69 | 671 |
| 2019 | 415 | 216 | 393 | 560 | 400 | 210 | 374 | 203 | 400 | 234 | 373 | 214 |
| 2020 | 4 | 4 | 475 | 64 | 130 | 2 | 289 | 369 | 440 | 146 | 594 | 306 |
| 2021 | 281 | 261 | 251 | 381 | 606 | 486 | 516 | 373 | 109 | 452 | 231 | 469 |
| 2022 | 316 | 202 | 370 | 556 | 148 | 292 | 187 | 777 | 520 | 610 | 205 | 380 |
| 2023 | 489 | 316 | 533 | 332 | 220 | 368 | 765 | 570 | 408 | 506 | 571 | 292 |
| 2024 | 404 | 396 | 774 | 704 | 541 | 757 | ||||||
| - = No Data Reported; -- = Not Applicable; NA = Not Available; W = Withheld to avoid disclosure of individual company data. |
| Release Date: 8/30/2024 |
| Next Release Date: 9/30/2024 |