|
Download Data (XLS File) |
|
||||||||
|
||||||||
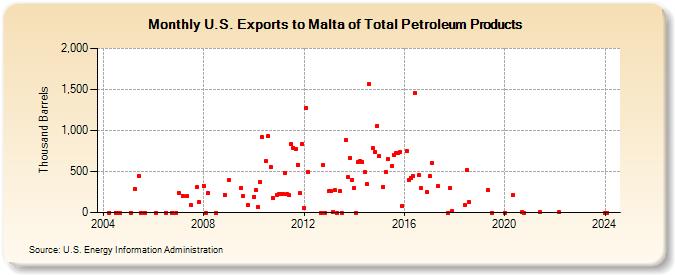
| U.S. Exports to Malta of Total Petroleum Products (Thousand Barrels) | ||||||||
| Year | Jan | Feb | Mar | Apr | May | Jun | Jul | Aug | Sep | Oct | Nov | Dec |
|---|---|---|---|---|---|---|---|---|---|---|---|---|
| 2004 | 0 | 0 | 0 | 0 | ||||||||
| 2005 | 0 | 288 | 440 | 0 | 0 | |||||||
| 2006 | 0 | 0 | 0 | 0 | ||||||||
| 2007 | 241 | 206 | 196 | 90 | 311 | 128 | ||||||
| 2008 | 328 | 0 | 241 | 0 | 215 | |||||||
| 2009 | 400 | 300 | 201 | 89 | ||||||||
| 2010 | 195 | 271 | 68 | 375 | 916 | 625 | 929 | 558 | 179 | 214 | ||
| 2011 | 226 | 226 | 225 | 486 | 226 | 210 | 837 | 791 | 771 | 585 | 240 | 838 |
| 2012 | 50 | 1,269 | 495 | 0 | 575 | 0 | ||||||
| 2013 | 257 | 258 | 1 | 270 | 0 | 257 | 0 | 881 | 433 | 668 | 402 | |
| 2014 | 301 | 0 | 620 | 628 | 617 | 490 | 347 | 1,566 | 781 | 743 | 1,059 | |
| 2015 | 683 | 313 | 496 | 648 | 572 | 705 | 722 | 722 | 742 | 83 | ||
| 2016 | 746 | 398 | 425 | 445 | 1,456 | 452 | 295 | 246 | ||||
| 2017 | 442 | 604 | 321 | 0 | 302 | 13 | ||||||
| 2018 | 89 | 520 | 127 | |||||||||
| 2019 | 274 | 0 | ||||||||||
| 2020 | 0 | 216 | 1 | 0 | ||||||||
| 2021 | 1 | |||||||||||
| 2022 | 1 | |||||||||||
| 2024 | 0 | |||||||||||
| - = No Data Reported; -- = Not Applicable; NA = Not Available; W = Withheld to avoid disclosure of individual company data. |
| Release Date: 3/29/2024 |
| Next Release Date: 4/30/2024 |