|
Download Data (XLS File) |
|
||||||||
|
||||||||
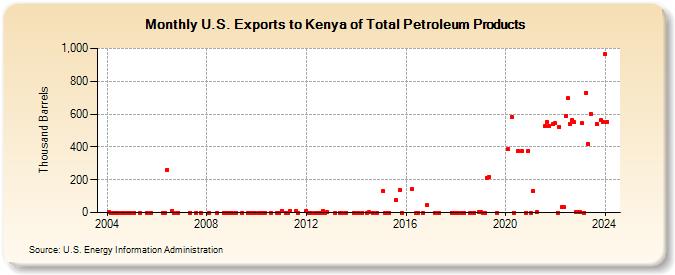
| U.S. Exports to Kenya of Total Petroleum Products (Thousand Barrels) | ||||||||
| Year | Jan | Feb | Mar | Apr | May | Jun | Jul | Aug | Sep | Oct | Nov | Dec |
|---|---|---|---|---|---|---|---|---|---|---|---|---|
| 2004 | 3 | 0 | 0 | 0 | 0 | 0 | 0 | 0 | 0 | |||
| 2005 | 0 | 0 | 0 | 0 | ||||||||
| 2006 | 0 | 0 | 261 | 8 | 0 | 0 | ||||||
| 2007 | 0 | 0 | 0 | |||||||||
| 2008 | 0 | 0 | 0 | 0 | 0 | 0 | ||||||
| 2009 | 0 | 0 | 0 | 0 | 0 | 0 | 0 | |||||
| 2010 | 0 | 0 | 0 | 0 | 0 | 0 | 0 | |||||
| 2011 | 11 | 0 | 0 | 11 | 10 | 0 | ||||||
| 2012 | 9 | 0 | 0 | 0 | 0 | 0 | 0 | 10 | 0 | 1 | ||
| 2013 | 0 | 0 | 0 | 0 | 0 | |||||||
| 2014 | 0 | 0 | 0 | 1 | 0 | 0 | ||||||
| 2015 | 130 | 0 | 0 | 0 | 78 | 138 | 0 | |||||
| 2016 | 145 | 0 | 0 | 0 | 46 | |||||||
| 2017 | 0 | 0 | 0 | 0 | ||||||||
| 2018 | 0 | 0 | 0 | 0 | 0 | 0 | 0 | 2 | ||||
| 2019 | 2 | 0 | 0 | 213 | 217 | 0 | ||||||
| 2020 | 385 | 581 | 0 | 377 | 372 | 0 | 374 | |||||
| 2021 | 0 | 132 | 1 | 526 | 552 | 530 | 537 | |||||
| 2022 | 543 | 0 | 523 | 33 | 34 | 588 | 695 | 539 | 563 | 550 | 2 | 3 |
| 2023 | 1 | 543 | 0 | 731 | 418 | 599 | 539 | 562 | 554 | |||
| 2024 | 964 | |||||||||||
| - = No Data Reported; -- = Not Applicable; NA = Not Available; W = Withheld to avoid disclosure of individual company data. |
| Release Date: 3/29/2024 |
| Next Release Date: 4/30/2024 |