|
Download Data (XLS File) |
|
||||||||
|
||||||||
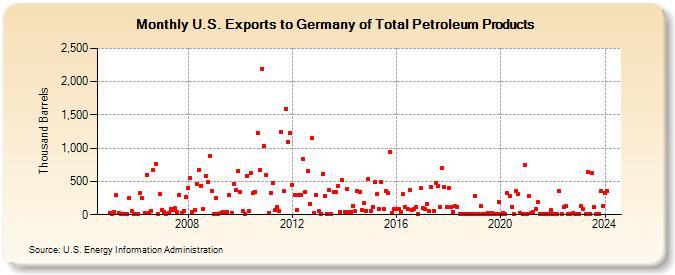
| U.S. Exports to Germany of Total Petroleum Products (Thousand Barrels) | ||||||||
| Year | Jan | Feb | Mar | Apr | May | Jun | Jul | Aug | Sep | Oct | Nov | Dec |
|---|---|---|---|---|---|---|---|---|---|---|---|---|
| 2005 | 19 | 16 | 37 | 290 | 29 | 4 | 9 | 11 | 9 | 252 | 55 | 5 |
| 2006 | 7 | 6 | 330 | 246 | 19 | 601 | 31 | 62 | 667 | 755 | 12 | 314 |
| 2007 | 69 | 37 | 12 | 28 | 89 | 64 | 96 | 37 | 298 | 30 | 61 | 266 |
| 2008 | 398 | 558 | 41 | 72 | 457 | 679 | 435 | 88 | 581 | 493 | 889 | 359 |
| 2009 | 15 | 247 | 18 | 32 | 34 | 30 | 36 | 290 | 22 | 466 | 371 | 662 |
| 2010 | 338 | 50 | 9 | 587 | 52 | 620 | 319 | 347 | 1,228 | 679 | 2,192 | 1,030 |
| 2011 | 600 | 29 | 329 | 472 | 64 | 114 | 53 | 1,242 | 349 | 1,593 | 1,086 | 1,228 |
| 2012 | 453 | 292 | 68 | 291 | 292 | 833 | 339 | 657 | 164 | 1,158 | 30 | 298 |
| 2013 | 50 | 18 | 611 | 282 | 9 | 370 | 10 | 337 | 339 | 435 | 36 | 516 |
| 2014 | 37 | 382 | 36 | 41 | 137 | 49 | 360 | 344 | 74 | 171 | 61 | 540 |
| 2015 | 61 | 117 | 490 | 306 | 88 | 491 | 79 | 350 | 328 | 948 | 32 | 90 |
| 2016 | 83 | 79 | 43 | 306 | 110 | 83 | 366 | 78 | 80 | 113 | 14 | 397 |
| 2017 | 107 | 79 | 164 | 52 | 421 | 56 | 484 | 436 | 116 | 708 | 418 | 109 |
| 2018 | 397 | 112 | 42 | 125 | 120 | 11 | 17 | 14 | 10 | 11 | 10 | 7 |
| 2019 | 288 | 15 | 17 | 124 | 11 | 10 | 28 | 10 | 21 | 8 | 16 | 196 |
| 2020 | 16 | 26 | 17 | 319 | 287 | 119 | 9 | 359 | 307 | 20 | 11 | 746 |
| 2021 | 9 | 280 | 24 | 48 | 93 | 189 | 10 | 14 | 6 | 14 | 12 | 67 |
| 2022 | 13 | 13 | 12 | 350 | 11 | 117 | 124 | 13 | 17 | 21 | 14 | 8 |
| 2023 | 10 | 127 | 85 | 11 | 645 | 15 | 621 | 116 | 17 | 13 | 351 | 128 |
| 2024 | 323 | |||||||||||
| - = No Data Reported; -- = Not Applicable; NA = Not Available; W = Withheld to avoid disclosure of individual company data. |
| Release Date: 3/29/2024 |
| Next Release Date: 4/30/2024 |