|
Download Data (XLS File) |
|
||||||||
|
||||||||
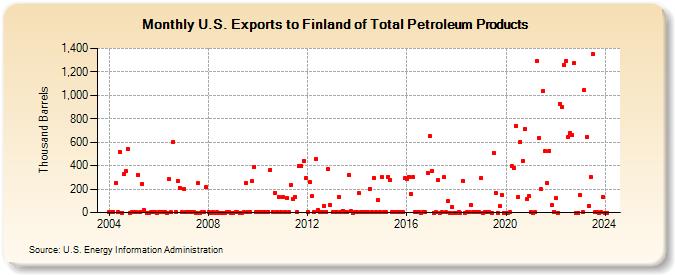
| U.S. Exports to Finland of Total Petroleum Products (Thousand Barrels) | ||||||||
| Year | Jan | Feb | Mar | Apr | May | Jun | Jul | Aug | Sep | Oct | Nov | Dec |
|---|---|---|---|---|---|---|---|---|---|---|---|---|
| 2004 | 1 | 2 | 3 | 252 | 2 | 517 | 0 | 326 | 354 | 545 | 0 | 1 |
| 2005 | 1 | 1 | 323 | 1 | 244 | 18 | 0 | 0 | 1 | 1 | 3 | 0 |
| 2006 | 2 | 1 | 2 | 1 | 0 | 285 | 1 | 604 | 9 | 267 | 212 | 1 |
| 2007 | 202 | 1 | 1 | 2 | 1 | 1 | 0 | 249 | 0 | 1 | 1 | 214 |
| 2008 | 4 | 0 | 3 | 0 | 1 | 0 | 0 | 0 | 0 | 1 | 1 | 0 |
| 2009 | 0 | 3 | 1 | 0 | 0 | 3 | 252 | 4 | 8 | 266 | 390 | 3 |
| 2010 | 4 | 2 | 1 | 1 | 7 | 5 | 366 | 9 | 168 | 5 | 135 | 6 |
| 2011 | 133 | 2 | 125 | 4 | 239 | 118 | 133 | 3 | 394 | 399 | 440 | 292 |
| 2012 | 4 | 257 | 137 | 5 | 456 | 22 | 7 | 9 | 55 | 5 | 369 | 65 |
| 2013 | 1 | 7 | 5 | 136 | 7 | 16 | 3 | 2 | 321 | 10 | 0 | 5 |
| 2014 | 2 | 164 | 1 | 4 | 1 | 1 | 203 | 2 | 298 | 1 | 111 | 6 |
| 2015 | 302 | 1 | 2 | 306 | 277 | 1 | 1 | 1 | 1 | 1 | 1 | 294 |
| 2016 | 288 | 306 | 161 | 304 | 9 | 2 | 1 | 0 | 1 | 1 | 339 | 651 |
| 2017 | 355 | 0 | 1 | 276 | 0 | 1 | 300 | 2 | 96 | 0 | 47 | 0 |
| 2018 | 0 | 1 | 0 | 268 | 0 | 1 | 2 | 61 | 2 | 1 | 1 | 4 |
| 2019 | 294 | 0 | 3 | 1 | 1 | 0 | 512 | 171 | 0 | 53 | 151 | 0 |
| 2020 | 0 | 0 | 2 | 393 | 380 | 740 | 131 | 604 | 441 | 709 | 112 | 139 |
| 2021 | 1 | 0 | 1 | 1,289 | 632 | 197 | 1,034 | 522 | 253 | 526 | 62 | 3 |
| 2022 | 121 | 0 | 927 | 902 | 1,261 | 1,293 | 646 | 675 | 662 | 1,272 | 0 | 0 |
| 2023 | 150 | 1 | 1,045 | 643 | 55 | 305 | 1,351 | 1 | 1 | 0 | 1 | 134 |
| 2024 | 0 | |||||||||||
| - = No Data Reported; -- = Not Applicable; NA = Not Available; W = Withheld to avoid disclosure of individual company data. |
| Release Date: 3/29/2024 |
| Next Release Date: 4/30/2024 |