|
Download Data (XLS File) |
|
||||||||
|
||||||||
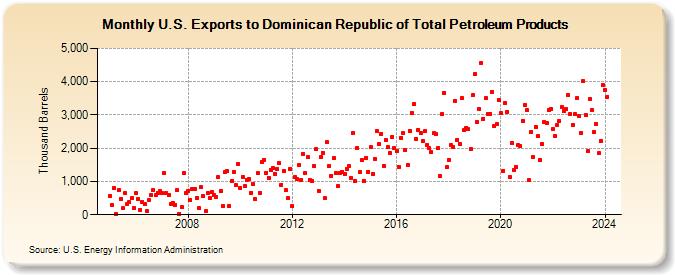
| U.S. Exports to Dominican Republic of Total Petroleum Products (Thousand Barrels) | ||||||||
| Year | Jan | Feb | Mar | Apr | May | Jun | Jul | Aug | Sep | Oct | Nov | Dec |
|---|---|---|---|---|---|---|---|---|---|---|---|---|
| 2005 | 563 | 281 | 801 | 13 | 734 | 487 | 187 | 641 | 319 | 368 | 494 | 213 |
| 2006 | 646 | 471 | 153 | 383 | 310 | 117 | 435 | 591 | 742 | 580 | 651 | 705 |
| 2007 | 656 | 1,242 | 659 | 586 | 337 | 360 | 306 | 742 | 29 | 239 | 1,259 | 647 |
| 2008 | 713 | 441 | 776 | 769 | 515 | 193 | 823 | 573 | 97 | 641 | 498 | 679 |
| 2009 | 596 | 537 | 1,124 | 719 | 257 | 1,276 | 1,312 | 256 | 1,009 | 1,290 | 882 | 1,537 |
| 2010 | 808 | 1,138 | 851 | 1,052 | 1,084 | 661 | 921 | 471 | 1,245 | 666 | 1,598 | 1,649 |
| 2011 | 1,264 | 1,112 | 1,347 | 1,401 | 1,237 | 1,374 | 1,541 | 906 | 1,319 | 730 | 488 | 1,386 |
| 2012 | 264 | 1,136 | 1,080 | 1,490 | 1,034 | 1,835 | 1,246 | 1,720 | 1,044 | 1,009 | 1,463 | 1,975 |
| 2013 | 723 | 1,731 | 1,863 | 493 | 2,177 | 1,461 | 1,177 | 1,703 | 1,257 | 862 | 1,251 | 1,290 |
| 2014 | 1,220 | 1,389 | 1,455 | 1,115 | 2,456 | 1,012 | 2,019 | 1,273 | 1,657 | 1,021 | 1,705 | 1,292 |
| 2015 | 2,022 | 1,227 | 1,684 | 2,509 | 2,123 | 2,440 | 1,475 | 2,244 | 2,031 | 1,857 | 2,346 | 1,992 |
| 2016 | 1,910 | 1,449 | 2,318 | 2,444 | 1,931 | 1,483 | 2,521 | 3,062 | 3,331 | 2,289 | 2,552 | 2,447 |
| 2017 | 2,207 | 2,522 | 2,102 | 1,996 | 1,883 | 2,448 | 2,436 | 2,003 | 1,177 | 3,022 | 3,668 | 1,434 |
| 2018 | 1,657 | 2,085 | 2,048 | 3,431 | 2,259 | 2,135 | 3,504 | 2,537 | 2,615 | 2,573 | 1,975 | 3,586 |
| 2019 | 4,219 | 2,787 | 3,173 | 4,564 | 2,887 | 3,495 | 3,023 | 3,041 | 3,696 | 2,653 | 2,716 | 3,447 |
| 2020 | 3,049 | 1,325 | 3,363 | 3,098 | 1,132 | 2,160 | 1,341 | 1,430 | 2,082 | 2,061 | 2,832 | 3,297 |
| 2021 | 3,134 | 1,030 | 2,501 | 1,725 | 2,644 | 2,361 | 1,651 | 2,124 | 2,783 | 2,750 | 3,139 | 3,180 |
| 2022 | 2,579 | 2,363 | 2,692 | 2,814 | 3,235 | 3,105 | 3,171 | 3,586 | 3,014 | 2,708 | 3,018 | 3,506 |
| 2023 | 2,970 | 2,460 | 4,008 | 2,998 | 1,918 | 3,486 | 3,133 | 2,483 | 2,713 | 1,843 | 2,223 | 3,902 |
| 2024 | 3,751 | 3,548 | ||||||||||
| - = No Data Reported; -- = Not Applicable; NA = Not Available; W = Withheld to avoid disclosure of individual company data. |
| Release Date: 4/30/2024 |
| Next Release Date: 5/31/2024 |