|
Download Data (XLS File) |
|
||||||||
|
||||||||
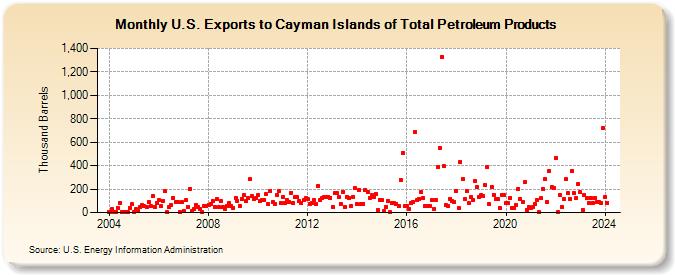
| U.S. Exports to Cayman Islands of Total Petroleum Products (Thousand Barrels) | ||||||||
| Year | Jan | Feb | Mar | Apr | May | Jun | Jul | Aug | Sep | Oct | Nov | Dec |
|---|---|---|---|---|---|---|---|---|---|---|---|---|
| 2004 | 1 | 29 | 2 | 1 | 42 | 82 | 1 | 3 | 1 | 3 | 41 | 69 |
| 2005 | 2 | 27 | 17 | 46 | 62 | 52 | 44 | 88 | 52 | 138 | 51 | 83 |
| 2006 | 104 | 53 | 102 | 180 | 2 | 46 | 64 | 123 | 92 | 92 | 2 | 86 |
| 2007 | 12 | 104 | 50 | 205 | 17 | 34 | 65 | 48 | 28 | 2 | 59 | 56 |
| 2008 | 67 | 76 | 100 | 49 | 118 | 46 | 95 | 46 | 27 | 60 | 78 | 60 |
| 2009 | 42 | 128 | 101 | 60 | 114 | 146 | 98 | 123 | 283 | 145 | 112 | 121 |
| 2010 | 149 | 96 | 108 | 109 | 159 | 72 | 184 | 90 | 75 | 153 | 180 | 81 |
| 2011 | 131 | 83 | 104 | 88 | 171 | 83 | 132 | 129 | 100 | 79 | 106 | 122 |
| 2012 | 115 | 72 | 83 | 107 | 73 | 230 | 106 | 123 | 129 | 135 | 133 | 128 |
| 2013 | 51 | 165 | 168 | 131 | 76 | 179 | 51 | 136 | 126 | 58 | 135 | 207 |
| 2014 | 72 | 191 | 77 | 76 | 193 | 176 | 125 | 147 | 136 | 161 | 20 | 110 |
| 2015 | 108 | 13 | 50 | 101 | 2 | 81 | 79 | 76 | 55 | 281 | 512 | 59 |
| 2016 | 59 | 32 | 81 | 90 | 688 | 105 | 116 | 176 | 122 | 52 | 53 | 58 |
| 2017 | 107 | 32 | 111 | 387 | 549 | 1,329 | 395 | 61 | 57 | 118 | 95 | 92 |
| 2018 | 185 | 38 | 427 | 286 | 115 | 185 | 81 | 132 | 110 | 266 | 217 | 133 |
| 2019 | 150 | 143 | 234 | 389 | 70 | 222 | 154 | 115 | 115 | 38 | 152 | 153 |
| 2020 | 79 | 78 | 127 | 42 | 40 | 61 | 205 | 114 | 94 | 258 | 22 | 47 |
| 2021 | 41 | 45 | 75 | 110 | 4 | 121 | 197 | 283 | 89 | 356 | 214 | 208 |
| 2022 | 466 | 9 | 149 | 49 | 114 | 284 | 165 | 118 | 356 | 166 | 126 | 244 |
| 2023 | 172 | 21 | 148 | 122 | 83 | 126 | 83 | 127 | 92 | 91 | 80 | 722 |
| 2024 | 134 | |||||||||||
| - = No Data Reported; -- = Not Applicable; NA = Not Available; W = Withheld to avoid disclosure of individual company data. |
| Release Date: 3/29/2024 |
| Next Release Date: 4/30/2024 |