|
Download Data (XLS File) |
|
||||||||
|
||||||||
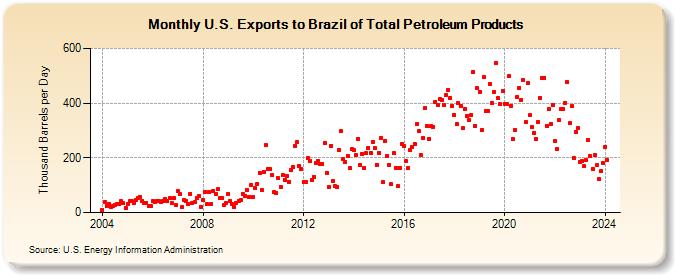
| U.S. Exports to Brazil of Total Petroleum Products (Thousand Barrels per Day) | ||||||||
| Year | Jan | Feb | Mar | Apr | May | Jun | Jul | Aug | Sep | Oct | Nov | Dec |
|---|---|---|---|---|---|---|---|---|---|---|---|---|
| 2004 | 11 | 38 | 24 | 32 | 20 | 25 | 27 | 30 | 31 | 41 | 34 | 15 |
| 2005 | 33 | 41 | 41 | 34 | 47 | 55 | 58 | 43 | 36 | 35 | 23 | 24 |
| 2006 | 41 | 40 | 44 | 41 | 40 | 41 | 48 | 41 | 52 | 35 | 53 | 26 |
| 2007 | 77 | 67 | 21 | 46 | 41 | 31 | 69 | 36 | 38 | 52 | 60 | 22 |
| 2008 | 47 | 74 | 30 | 74 | 32 | 78 | 67 | 85 | 52 | 54 | 29 | 34 |
| 2009 | 68 | 42 | 30 | 21 | 35 | 44 | 46 | 68 | 59 | 83 | 58 | 102 |
| 2010 | 56 | 88 | 106 | 146 | 83 | 149 | 247 | 161 | 159 | 136 | 75 | 73 |
| 2011 | 125 | 93 | 138 | 120 | 135 | 113 | 156 | 165 | 244 | 257 | 170 | 160 |
| 2012 | 112 | 110 | 201 | 189 | 119 | 131 | 181 | 189 | 179 | 178 | 255 | 145 |
| 2013 | 93 | 245 | 115 | 96 | 94 | 228 | 298 | 196 | 185 | 205 | 162 | 232 |
| 2014 | 227 | 212 | 270 | 172 | 215 | 164 | 216 | 237 | 219 | 259 | 237 | 175 |
| 2015 | 218 | 274 | 110 | 262 | 207 | 175 | 103 | 216 | 164 | 97 | 163 | 252 |
| 2016 | 243 | 189 | 162 | 228 | 241 | 251 | 323 | 298 | 211 | 273 | 381 | 315 |
| 2017 | 270 | 317 | 312 | 405 | 393 | 414 | 410 | 393 | 430 | 449 | 419 | 391 |
| 2018 | 357 | 322 | 399 | 391 | 308 | 380 | 354 | 337 | 356 | 514 | 318 | 455 |
| 2019 | 442 | 303 | 494 | 371 | 373 | 470 | 400 | 442 | 546 | 418 | 396 | 445 |
| 2020 | 398 | 396 | 498 | 391 | 268 | 301 | 423 | 457 | 413 | 483 | 331 | 472 |
| 2021 | 355 | 311 | 292 | 268 | 331 | 419 | 491 | 493 | 316 | 377 | 324 | 393 |
| 2022 | 260 | 232 | 339 | 380 | 378 | 401 | 477 | 327 | 388 | 200 | 295 | 309 |
| 2023 | 185 | 188 | 169 | 192 | 264 | 205 | 160 | 210 | 173 | 122 | 151 | 181 |
| 2024 | 239 | |||||||||||
| - = No Data Reported; -- = Not Applicable; NA = Not Available; W = Withheld to avoid disclosure of individual company data. |
| Release Date: 3/29/2024 |
| Next Release Date: 4/30/2024 |