|
Download Data (XLS File) |
|
||||||||
|
||||||||
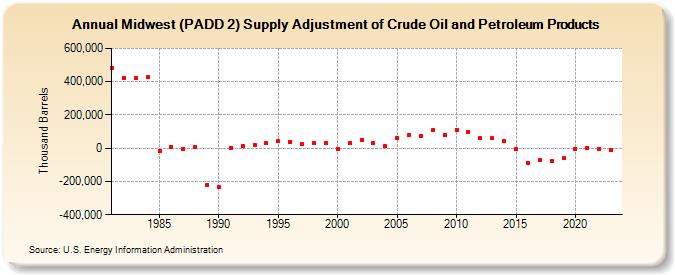
| Midwest (PADD 2) Supply Adjustment of Crude Oil and Petroleum Products (Thousand Barrels) | ||||||||
| Decade | Year-0 | Year-1 | Year-2 | Year-3 | Year-4 | Year-5 | Year-6 | Year-7 | Year-8 | Year-9 |
|---|---|---|---|---|---|---|---|---|---|---|
| 1980's | 484,872 | 424,552 | 419,848 | 426,935 | -16,449 | 8,669 | -3,222 | 6,631 | -219,070 | |
| 1990's | -234,993 | 3,957 | 13,186 | 21,002 | 28,926 | 41,119 | 37,413 | 23,791 | 31,230 | 28,452 |
| 2000's | -1,903 | 29,910 | 51,935 | 28,336 | 12,686 | 62,568 | 77,501 | 73,612 | 106,872 | 80,619 |
| 2010's | 110,971 | 95,717 | 58,940 | 58,761 | 45,173 | -7,593 | -87,456 | -71,435 | -74,562 | -61,263 |
| 2020's | -3,899 | 26 | -2,199 | -11,910 |
| - = No Data Reported; -- = Not Applicable; NA = Not Available; W = Withheld to avoid disclosure of individual company data. |
| Release Date: 4/30/2024 |
| Next Release Date: 8/30/2024 |