|
Download Data (XLS File) |
|
||||||||
|
||||||||
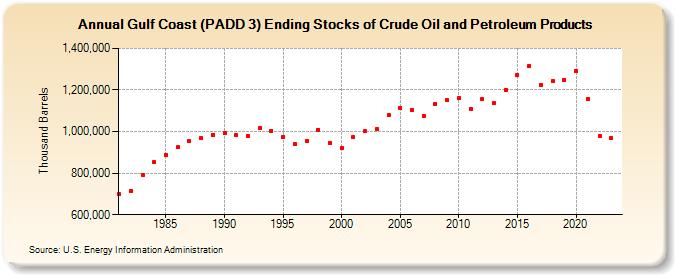
| Gulf Coast (PADD 3) Ending Stocks of Crude Oil and Petroleum Products (Thousand Barrels) | ||||||||
| Decade | Year-0 | Year-1 | Year-2 | Year-3 | Year-4 | Year-5 | Year-6 | Year-7 | Year-8 | Year-9 |
|---|---|---|---|---|---|---|---|---|---|---|
| 1980's | 698,273 | 713,440 | 792,393 | 852,661 | 887,409 | 923,454 | 954,054 | 966,881 | 985,766 | |
| 1990's | 992,774 | 981,943 | 980,315 | 1,015,229 | 1,003,868 | 975,572 | 940,191 | 955,782 | 1,009,453 | 945,306 |
| 2000's | 919,927 | 975,988 | 1,000,253 | 1,013,405 | 1,079,447 | 1,112,850 | 1,105,677 | 1,076,199 | 1,134,570 | 1,149,714 |
| 2010's | 1,162,261 | 1,107,438 | 1,154,370 | 1,135,906 | 1,201,739 | 1,271,666 | 1,314,784 | 1,224,919 | 1,243,562 | 1,249,495 |
| 2020's | 1,290,869 | 1,158,611 | 979,449 | 968,638 |
| - = No Data Reported; -- = Not Applicable; NA = Not Available; W = Withheld to avoid disclosure of individual company data. |
| Release Date: 3/29/2024 |
| Next Release Date: 8/30/2024 |