|
Download Data (XLS File) |
|
||||||||
|
||||||||
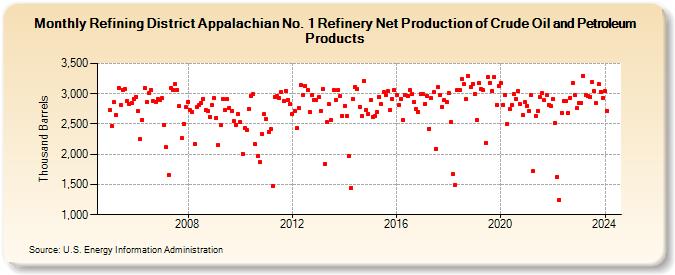
| Refining District Appalachian No. 1 Refinery Net Production of Crude Oil and Petroleum Products (Thousand Barrels) | ||||||||
| Year | Jan | Feb | Mar | Apr | May | Jun | Jul | Aug | Sep | Oct | Nov | Dec |
|---|---|---|---|---|---|---|---|---|---|---|---|---|
| 2005 | 2,729 | 2,468 | 2,863 | 2,649 | 3,096 | 2,820 | 3,066 | 3,081 | 2,881 | 2,837 | 2,851 | 2,917 |
| 2006 | 2,953 | 2,714 | 2,251 | 2,571 | 3,098 | 2,867 | 3,012 | 3,057 | 2,873 | 2,868 | 2,909 | 2,901 |
| 2007 | 2,922 | 2,487 | 2,114 | 1,658 | 3,094 | 3,066 | 3,154 | 3,067 | 2,789 | 2,268 | 2,505 | 2,774 |
| 2008 | 2,869 | 2,723 | 2,695 | 2,170 | 2,773 | 2,807 | 2,847 | 2,919 | 2,729 | 2,716 | 2,618 | 2,816 |
| 2009 | 2,922 | 2,606 | 2,149 | 2,479 | 2,918 | 2,736 | 2,915 | 2,766 | 2,711 | 2,545 | 2,478 | 2,665 |
| 2010 | 2,533 | 2,009 | 2,436 | 2,400 | 2,750 | 2,968 | 2,995 | 2,163 | 1,969 | 1,865 | 2,336 | 2,660 |
| 2011 | 2,579 | 2,368 | 2,421 | 1,467 | 2,951 | 2,963 | 2,927 | 3,023 | 2,872 | 3,051 | 2,904 | 2,828 |
| 2012 | 2,671 | 2,719 | 2,432 | 2,759 | 3,139 | 2,986 | 3,124 | 3,063 | 2,704 | 2,971 | 2,896 | 2,895 |
| 2013 | 2,943 | 2,720 | 3,075 | 1,839 | 2,528 | 2,824 | 2,565 | 3,069 | 2,898 | 3,063 | 2,958 | 2,632 |
| 2014 | 2,803 | 2,637 | 1,964 | 1,449 | 2,912 | 3,109 | 3,078 | 2,784 | 2,628 | 3,218 | 2,731 | 2,666 |
| 2015 | 2,899 | 2,621 | 2,638 | 2,696 | 2,944 | 2,823 | 3,021 | 2,977 | 3,040 | 2,728 | 2,912 | 3,054 |
| 2016 | 2,983 | 2,810 | 2,921 | 2,559 | 2,974 | 2,962 | 3,055 | 2,993 | 2,855 | 2,751 | 2,702 | 2,988 |
| 2017 | 2,999 | 2,833 | 2,966 | 2,422 | 2,928 | 3,021 | 2,093 | 3,104 | 2,985 | 2,785 | 2,892 | 2,857 |
| 2018 | 3,005 | 2,526 | 1,665 | 1,497 | 3,060 | 3,063 | 3,244 | 3,156 | 2,906 | 3,298 | 3,111 | 3,161 |
| 2019 | 2,999 | 2,566 | 3,174 | 3,077 | 3,057 | 2,190 | 3,276 | 3,180 | 3,044 | 3,280 | 2,818 | 3,130 |
| 2020 | 3,182 | 2,816 | 2,983 | 2,504 | 2,743 | 2,811 | 2,993 | 2,919 | 3,042 | 2,825 | 2,643 | 2,862 |
| 2021 | 2,802 | 2,718 | 2,976 | 1,719 | 2,636 | 2,717 | 2,948 | 3,004 | 2,891 | 2,982 | 2,818 | 2,794 |
| 2022 | 2,906 | 2,522 | 1,625 | 1,248 | 2,689 | 2,887 | 2,872 | 2,682 | 2,935 | 3,184 | 2,973 | 2,756 |
| 2023 | 2,845 | 2,847 | 3,298 | 2,984 | 2,965 | 2,949 | 3,199 | 3,044 | 2,842 | 3,155 | 3,036 | 2,935 |
| 2024 | 3,045 | |||||||||||
| - = No Data Reported; -- = Not Applicable; NA = Not Available; W = Withheld to avoid disclosure of individual company data. |
| Release Date: 3/29/2024 |
| Next Release Date: 4/30/2024 |