|
Download Data (XLS File) |
|
||||||||
|
||||||||
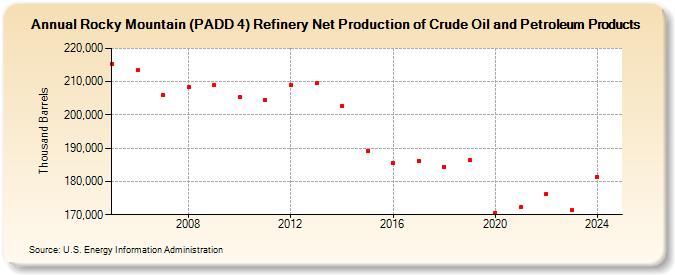
| Rocky Mountain (PADD 4) Refinery Net Production of Crude Oil and Petroleum Products (Thousand Barrels) | ||||||||
| Decade | Year-0 | Year-1 | Year-2 | Year-3 | Year-4 | Year-5 | Year-6 | Year-7 | Year-8 | Year-9 |
|---|---|---|---|---|---|---|---|---|---|---|
| 2000's | 215,405 | 213,387 | 206,046 | 208,279 | 209,007 | |||||
| 2010's | 205,325 | 204,472 | 208,958 | 209,495 | 202,801 | 189,229 | 185,553 | 186,293 | 184,450 | 186,369 |
| 2020's | 170,638 | 172,201 | 176,162 | 171,337 |
| - = No Data Reported; -- = Not Applicable; NA = Not Available; W = Withheld to avoid disclosure of individual company data. |
| Release Date: 8/30/2024 |
| Next Release Date: 8/29/2025 |